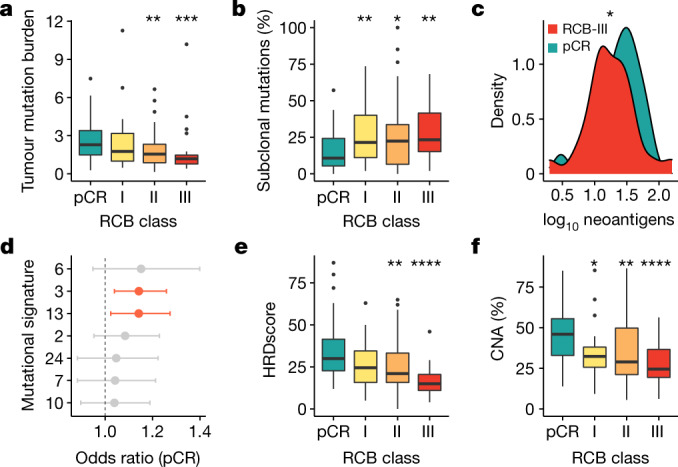
Fig. 2. Genomic features monotonically associate with response to therapy.

a, b, Box plots showing monotonic association between RCB class: total tumour mutation burden (a) (P = 0.004, ordinal logistic regression; pCR versus RCB-II **P = 0.001 and RCB-III ***P = 0.0002), and the percentage of subclonal mutations (b) (P = 0.02, ordinal logistic regression; pCR versus RCB-I **P = 0.007, RCB-II *P = 0.04 and RCB-III **P = 0.001). c, Density curves showing distribution of neoantigens in tumours that attained pCR and RCB-III (monotonic association, P = 0.03, ordinal logistic regression; pCR versus RCB-III *P < 0.05). d, Associations between mutational signatures and pCR. Statistically significant associations obtained from logistic regression are shown in red (HRD: 3; APOBEC: 13). The measure of the centre is the parameter estimate, and the error bars represent 95% confidence intervals; the vertical dashed line corresponds to an odds ratio of 1. e, f, Box plots showing monotonic association between RCB class and HRD score (e) (P = 0.00001, ordinal logistic regression; pCR versus RCB-II **P = 0.006 and RCB-III ****P = 3 × 10⁻⁶), and the percentage of copy number alterations (CNAs; f) (P = 0.0002, ordinal logistic regression; pCR versus RCB-I *P = 0.01, RCB-II **P = 0.004 and RCB-III ****P = 7 × 10⁻⁵). In a–f, the number of patients with DNA sequencing data: 40 (for pCR), 24 (for RCB-I), 64 (for RCB-II) and 27 (for RCB-III). In a, b, e, f, the box bounds the interquartile range divided by the median, with the whiskers extending to a maximum of 1.5 times the interquartile range beyond the box. Outliers are shown as dots. Wilcoxon rank-sum tests; all P values are two-sided.
