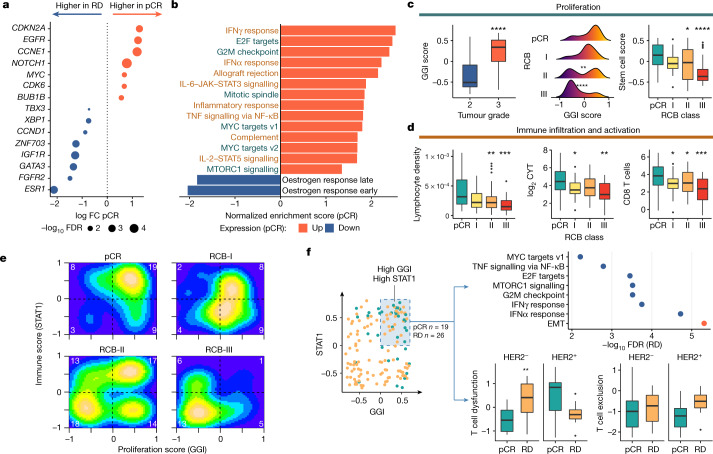
Fig. 3. Transcriptomic features associated with response to neoadjuvant therapy.
a, Expression of breast cancer driver genes associated with pCR. FC, fold change; RD, residual disease. b, MSigDB Hallmark gene sets associated with pCR. Response was predominantly associated with proliferative (green) and immune (brown) gene sets. c, Box plot showing association of GGI score with histological grade (P = 5 × 10⁻¹¹) (left); density plots showing monotonic association (P = 2 × 10⁻⁵, ordinal logistic regression) between GGI score and RCB (pCR versus RCB-II **P = 0.01 and RCB-III ****P = 3 × 10⁻⁵) (middle); and box plot showing monotonic association (P = 0.0001, ordinal logistic regression) between stem -cell enrichment score and RCB (pCR versus RCB-II *P = 0.02 and RCB-III ****P = 7 × 10⁻⁵) (right). The number of patients with RNA sequencing data: 39 (for pCR), 23 (for RCB-I), 62 (for RCB-II) and 25 (for RCB-III). d, Box plots showing monotonic associations between computationally estimated lymphocyte density and RCB (P < 1 × 10⁻¹⁰, ordinal logistic regression; n = 153 cases with digital pathology data; pCR versus RCB-II **P = 0.006 and RCB-III ***P = 0.0001) (left); CYT score and RCB (P = 0.001; n = 149 cases with RNA sequencing data; pCR versus RCB-I *P = 0.03 and RCB-III **P = 0.001) (middle); and Danaher CD8 T cell enrichment and RCB (P = 0.0002; n = 149 cases; pCR versus RCB-I *P = 0.04, RCB-II *P = 0.04 and RCB-III ***P = 0.0003) (right). e, 2D density plot showing the relationship between proliferation and immune activation across RCB classes. The number of cases in each quadrant is shown in white. f, The distribution of GGI and STAT1 scores across cohort (left). The shaded area represents samples with proliferation and immune enrichment values above the mean (n = 45 cases). The MSigDB Hallmarks pathways associated with residual disease in these 45 tumours (red represents overexpressed, and blue indicates underexpressed) (top right). Box plots showing association between T cell dysfunction (**P = 0.006 HER2−) and exclusion with response in these tumours are also shown (bottom right). EMT, epithelial-to-mesenchymal transition. In c, d, f, the box bounds the interquartile range divided by the median, with the whiskers extending to a maximum of 1.5 times the interquartile range beyond the box. Wilcoxon rank-sum tests; all P values are two-sided.

