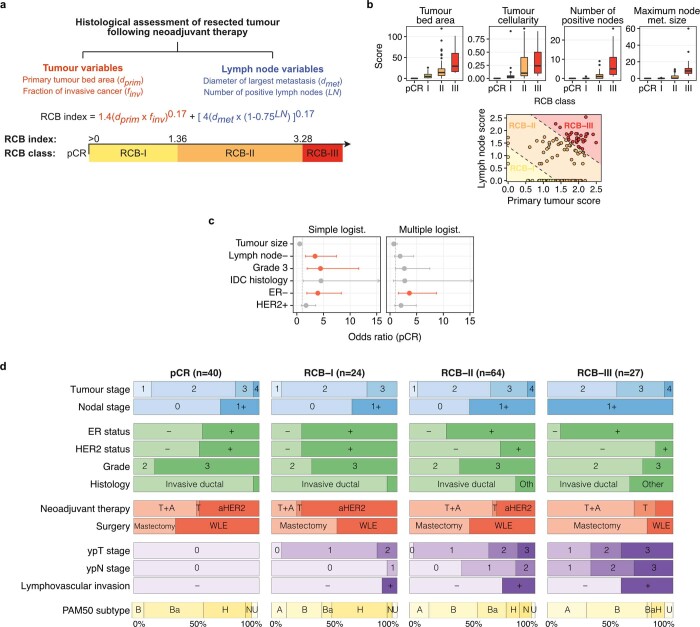
Extended Data Fig. 2. Calculation of the Residual Cancer Burden index and associations between clinical features and response.
a, Tumour and lymph node histological features used to calculate the continuous Residual Cancer Burden (RCB) index and categorical RCB class. Increasing RCB index denotes increasing burden of residual disease post-neoadjuvant therapy and increasing chemoresistance. b, Top: Box plots showing distribution of tumour and lymph node histological features in n = 161 cases with clinical data and RCB assessment across the RCB classes. The box bounds the interquartile range divided by the median, with the whiskers extending to a maximum of 1.5 times the interquartile range beyond the box. Outliers are shown as dots. Bottom: distribution of primary tumour score and lymph node score across RCB classes. c, Associations of clinical variables with pCR using simple and multiple logistic regression. Significant associations (P < 0.05, logistic regression) are shown in red. The measure of centre is the parameter estimate and error bars represent 95% confidence intervals. d, Distribution of tumour features across RCB classes: pre-operative staging (blue), pre-operative histological features (green), neoadjuvant therapy (red, T: taxane, A: anthracycline, aHER2: anti-HER2 therapy), surgical approach (red, WLE: wide local excision), post-operative tumour (ypT) and nodal (ypN) staging and lymphovascular invasion (purple) and PAM50 subtypes (yellow, A: Luminal A, B: Luminal B, Ba: Basal, H: HER2-enriched, N: Normal-like, U: Unknown). Tumours with RCB assessment and adequate therapy exposure only included (more than 1 cycle of chemotherapy or anti-HER2 therapy received, n = 155).

