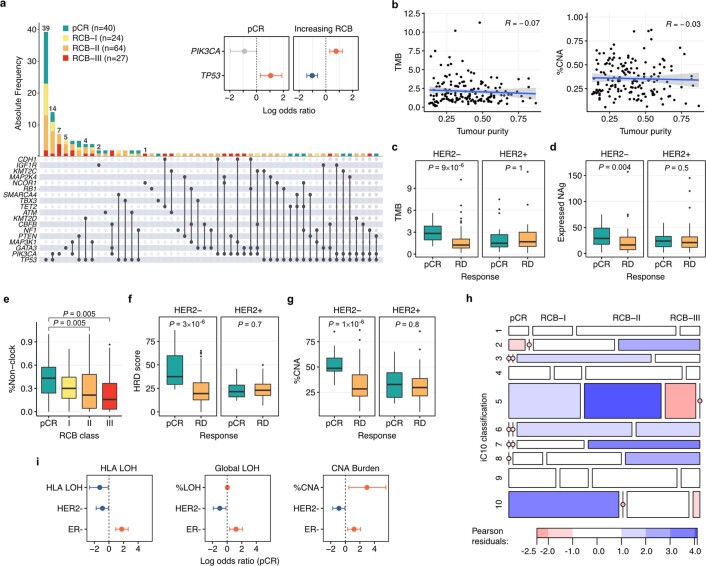
Extended Data Fig. 4. Further associations between genomic features and response to neoadjuvant therapy.
a, Interaction plot showing co-occurrence of non-silent driver gene mutations and response. Associations between TP53 and PIK3CA mutations and response shown in inset (logistic regression, red: positive, blue: negative, grey: not significant, error bars represent 95% confidence intervals). b, Pearson’s product-moment correlations (R) between tumour purity and (left) tumour mutation burden and (right) %CNAs. The shaded area, in grey, represents the 95% confidence interval. c, Box plots showing associations between TMB and response, stratified by HER2 status. d, Box plots showing association between expressed neoantigen (NAg) load and response, stratified by HER2 status. e, Box plot showing monotonic association (P = 0.005, ordinal logistic regression) between exposure of non-clock signatures and RCB class. f, Box plots showing associations between HRD score and response, stratified by HER2 status. g, Box plots showing associations between %CNA and response, stratified by HER2 status. c–g, The box bounds the interquartile range divided by the median, with the whiskers extending to a maximum of 1.5 times the interquartile range beyond the box. Outliers are shown as dots. Wilcoxon rank sum tests, all P values two-sided. Number of cases analysed (n) = 155 (HER2- pCR = 22, RD (residual disease) = 76; HER2+ pCR = 18, RD = 39)). h, Associations between RCB class and iC10: Pearson residuals indicate overrepresentation of iC10 subtype with response (blue: overrepresentation, red: underrepresentation). i, Associations between HLA LOH, global LOH and global copy number alterations with pCR (logistic regression, red: positive association, blue: negative association). The measure of centre is the parameter estimate and error bars represent 95% confidence intervals.

