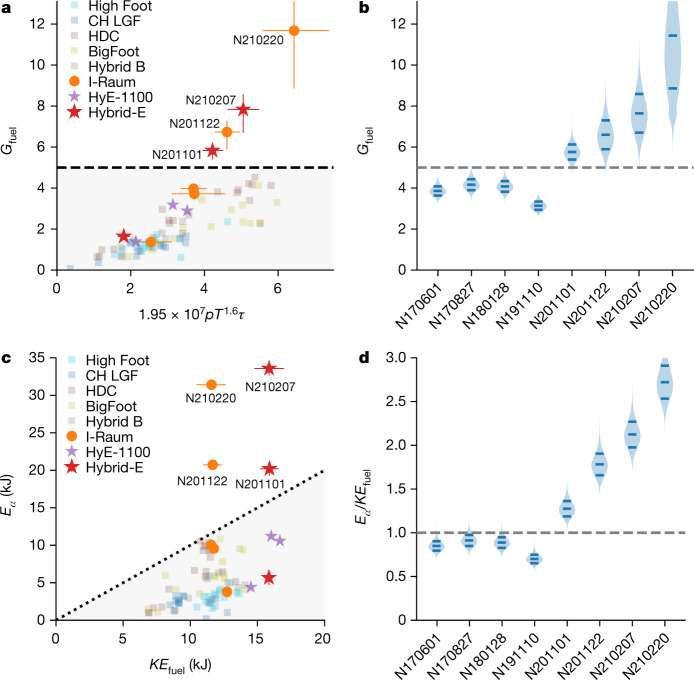
Fig. 2. Simple metrics for assessing a burning plasma.
a, Total fuel gain versus Lawson-like parameter; Gfuel > 5 corresponds to the burning-plasma regime. b, Probability distributions for Gfuel for high-performing experiments. In these plots the width of the shaded region is proportional to the probability distribution and the solid lines mark the 16th, 50th and 84th percentiles of the distribution c, Total α-heating energy versus fuel kinetic energy, Eα/KEfuel > 1 corresponds to Qα > 1. d, Probability distributions in Eα/KEfuel criteria for high-performing experiments. Error bars in a, c are 1 standard deviation (s.d.) and are shown only for the I-Raum and Hybrid-E points. Historical data are from refs. 4,14,15,19–21,29–31.

