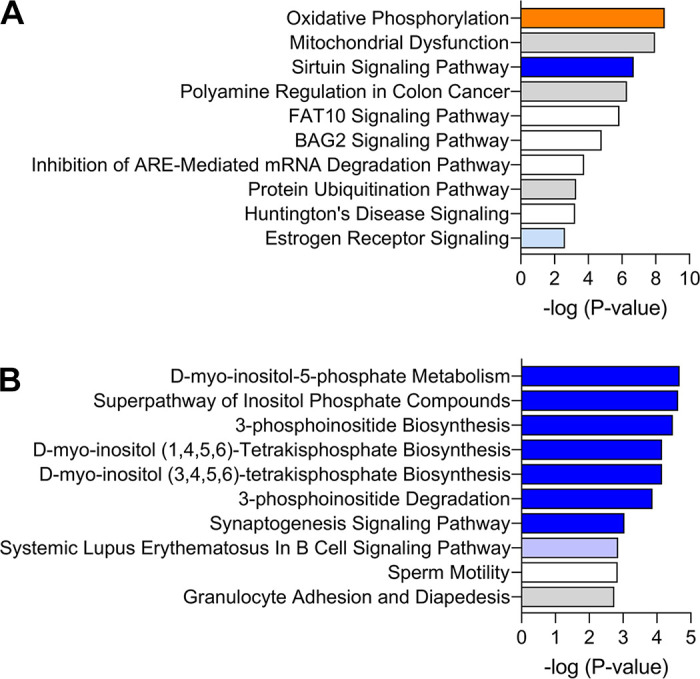
Figure 2.

Top 10 enriched canonical pathways in the analysis of: A: progesterone concentrations and B: pregnancy outcomes. The orange and blue-colored bars indicate predicted pathway activation or predicted inhibition, respectively, according to the z-score. White bars are those with a z-score at or very close to 0. Gray bars indicate pathways where no prediction can be made.
