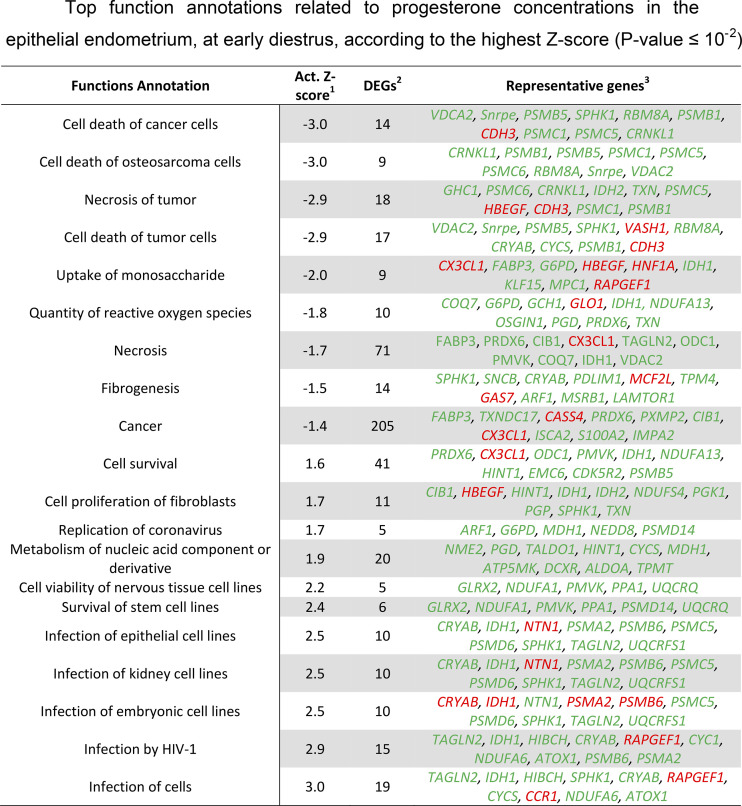
Figure 3.
Top function annotations related to progesterone concentrations in the epithelial endometrium, at early diestrus, according to the highest z-score (P value ≤ 10−2). 1: activation z-score (negative and positive z-scores predict decrease and increase of function annotations, respectively). Functions with z-score ≥ |2| are predicted to be activated. 2: differentially expressed genes (DEGs). 3: top 10 DEGs among the function annotations based on P-value. Genes in red and green are related negatively and positively with progesterone concentrations.

