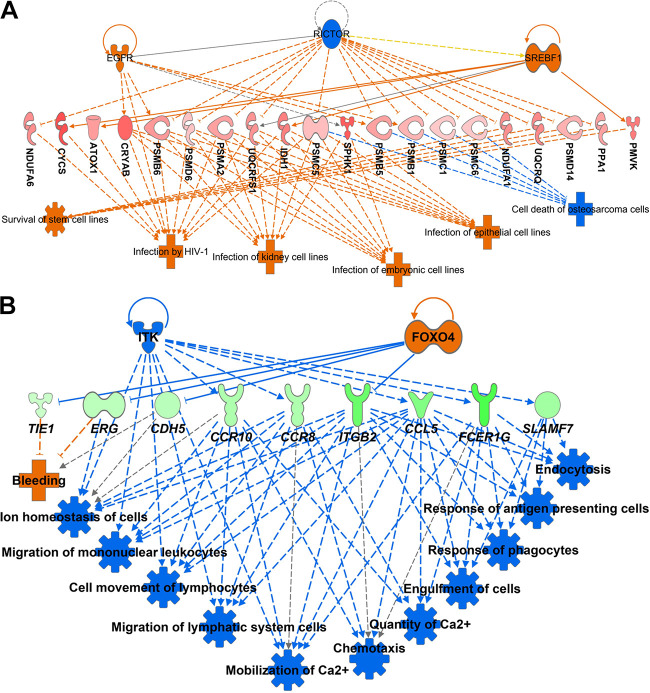
Figure 4.
Downstream annotation functions associated with plasma progesterone concentrations on day 4 after estrus (A) and pregnancy outcomes (B). Representation of upstream regulators, target genes in the dataset, and the consequent downstream effects. Upstream regulators and downstream effects colored in orange and blue, represents increased and decreased predicted activity, respectively. DEGs colored in red, and green denote a positive and negative relationship, respectively, with progesterone concentrations or odds of pregnancy. Color intensity indicates the degree of up or downregulation in the data set. Lines colored in orange and blue represents a relationship that leads to activation or inhibition, respectively. Gray and yellow lines indicate that the effect could not be predicted, or there was an inconsistency with the state of the downstream molecule, respectively. Solid and dashed lines imply direct and indirect relationships, respectively. The pointed and blunted arrowheads represent activation and inhibitory relationships, respectively. Legends for the shape of molecules and functions is at the IPA website (https://qiagen.secure.force.com/KnowledgeBase/articles/Basic_Technical_Q_A/Legend). DEGs, differentially expressed genes; IPA, Ingenuity Pathway Analysis.

