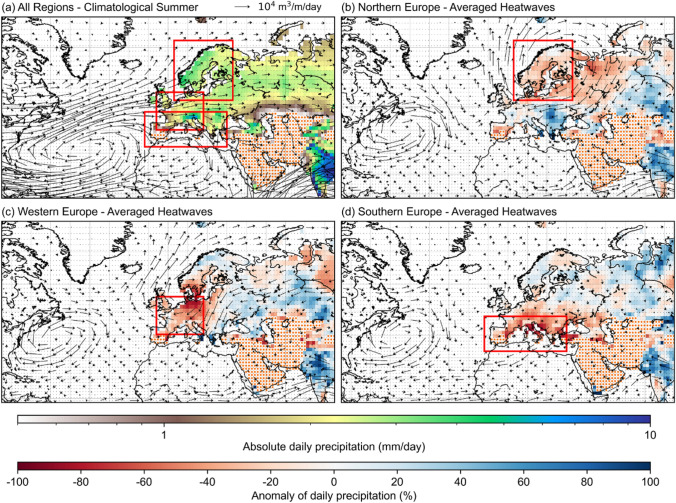
Fig. 2.
Anomalous moisture fluxes over local maxima of precipitation reduction around the study regions. a Daily mean precipitation () during climatological summer (1979–2018) (in color shading). The arrows symbolize the quantity and direction of moisture fluxes (), given in Eqs. 1 and 2. The red boxes bound the three study regions. Precipitation anomaly () averaged over all heatwaves days (in color shading) and anomaly of daily moisture fluxes () (in arrows) in b Northern Europe, c Western Europe, and d Southern Europe. Spatial coverage with orange dots in b–d are areas with summer precipitation of lower than 0.5 mm per day

