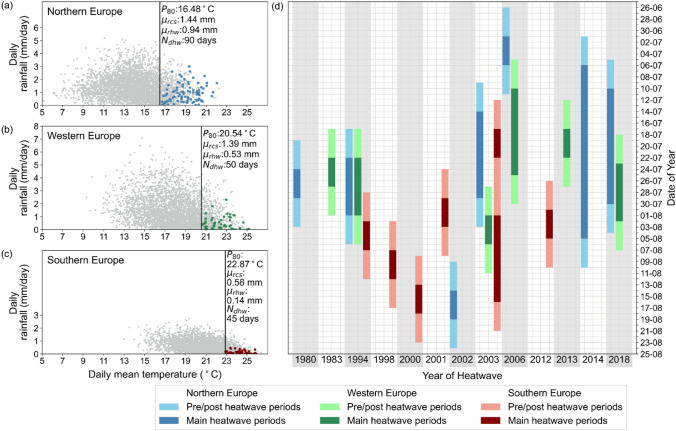
Fig. 5.
Reduction of precipitation during heatwaves and temporal distribution of selected heatwaves throughout the summer. Daily rainfall () against daily mean temperature () of summer days in June, July, August from 1979 to 2018 in a Northern Europe, b Western Europe, and c Southern Europe. Color shaded points in a blue, b green, and c red are selected heatwaves dates. is the daily mean temperature threshold for each region, is daily mean precipitation during climatological summer, is daily mean precipitation during heatwaves days, and is the total number of heatwaves days. d Selected periods of heatwaves for each region

