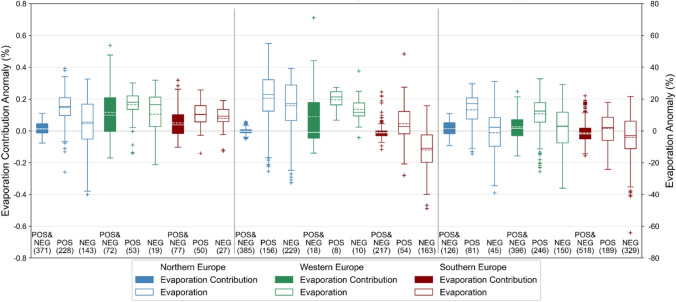
Fig. 6.
Contribution from different land covers in local moisture recycling during heatwaves. Evaporation contribution anomaly (, color-filled boxplots) and evaporation anomaly (, empty boxplots) from forests (left), other natural vegetation (middle), and anthropogenic land covers (right) in each region during heatwaves. Positively- (negatively-) contributing cells are identified as cells that increase (decrease) their evaporation contribution during heatwaves. is based on the corresponding positively-contributing () and negatively-contributing () cells. Values in brackets represent the number of cells from all heatwaves that constitute each boxplot

