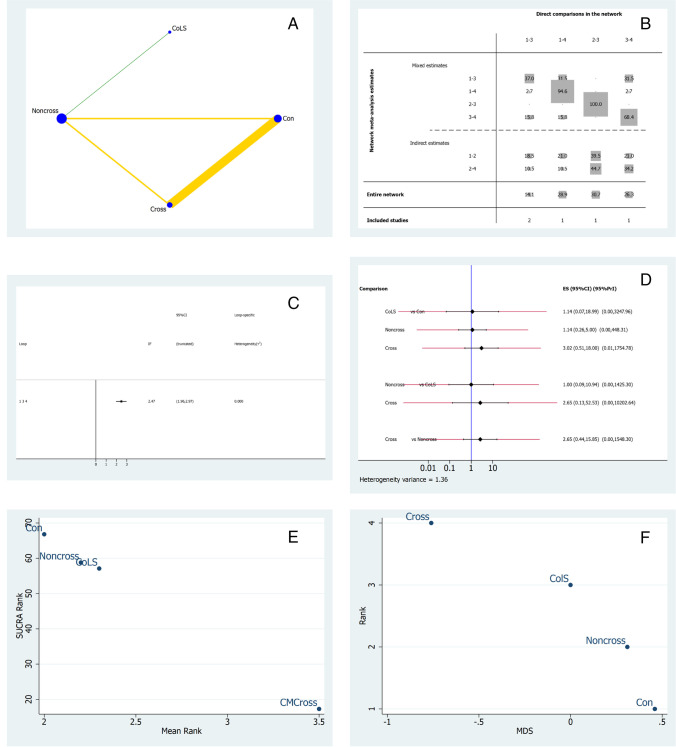
Fig. 4.
NMA for vertical buccal height. A Network geometry plot, the color of the edges corresponds to the average bias risk and the size of the blue dots is proportional to the sample size of that study group. The thickness of the lines demonstrates the number of comparisons made between the two groups of treatment. B Contribution plot. C Inconsistency plot of entire network. D Predictive interval and confidence interval plot: we can consider the values on the left as favoring second intervention and right as favoring first intervention [41]. E Surface under the cumulative ranking curve (SUCRA). F Multidimensional scale ranking (MDS) for keratinized mucosa thickness. Con (treatment n.1) = control; CM-Noncross (n.2) = collagen membrane non-crosslinked, ColS (n.3) = collagen sponge;; CM-Cross (n.4) = collagen membrane crosslinked

