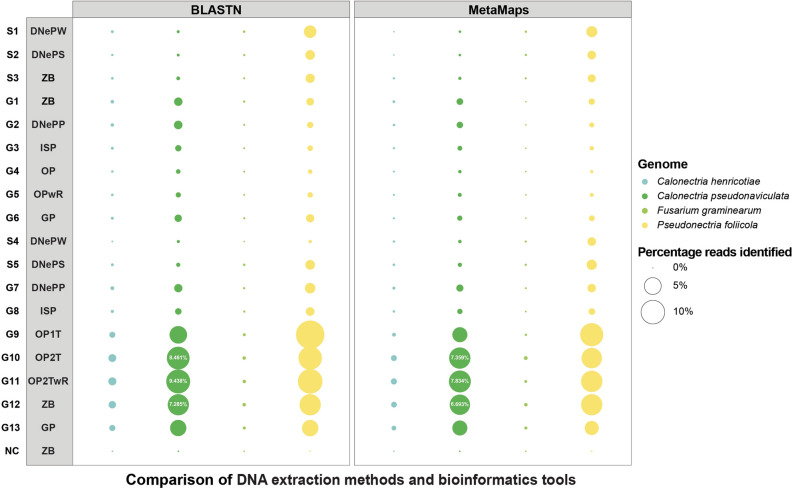
Figure 2.
Bubble plot showing the percentage of sequencing reads assigned to four fungal species in each sequenced sample. The column on the left displays the sample IDs and the column to its right displays the abbreviations of DNA extraction kits (see Table 1). Bubble size is proportional to the percentage of reads assigned to the four species listed on the right based on the tools BLASTN and MetaMaps using a small fungal database containing one genome per fungal species.

