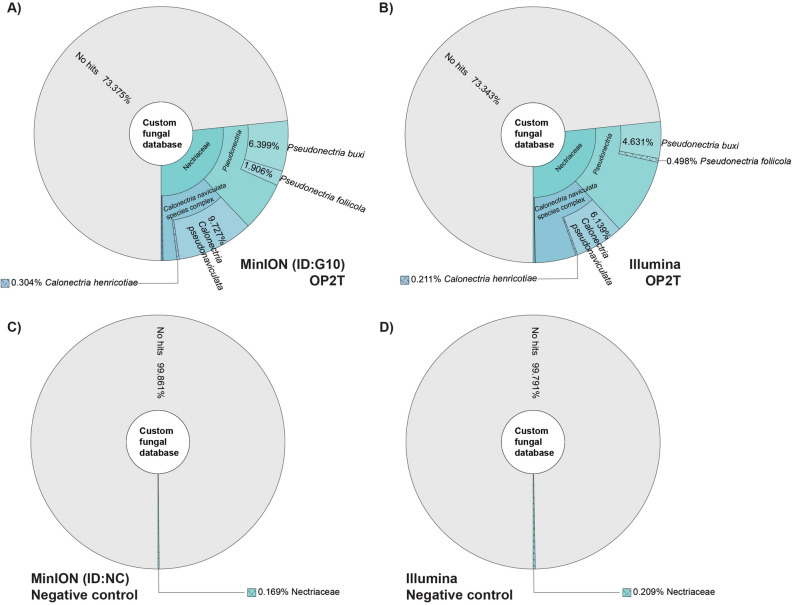
Figure 4.
Krona plots showing the fraction of reads identified as members of the family Nectriaceae as a percentage of all sequencing reads using the tool Kraken 2 and a database of 29 genomes. Each color represents a clade. (A) Results of G10 sequenced on the ONT MinION. (B) Results of G10 sequenced on the Illumina HiSeq 3000 platform. (C) Results of a healthy sample sequenced on the ONT MinION. (D) Results of another healthy sample sequenced on the Illumina Nova Seq 6000 Platform.

