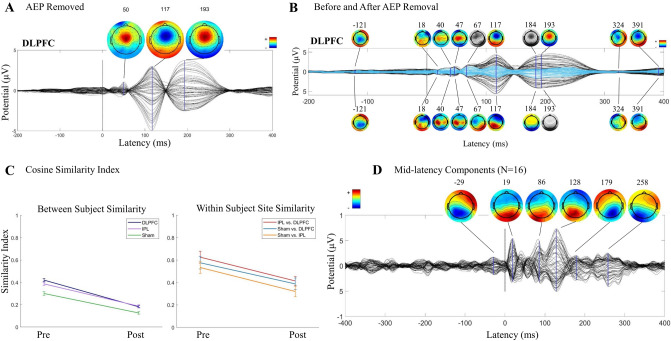
Figure 6.
Validation using cohort of older adults (≥ 65 years) from SAGES study. 20 of the 24 participants have AEP components, regardless of the noise masking protocol, and this N = 20 is shown here. (A) AEP components removed, averaged across all participants (N = 20; DLPFC after being unmerged from other conditions). (B) DLPFC condition TEPs/topography pre (black/above) and post (blue/below) removal of AEP components. Topoplots are greyscale if no peak is present at the indicated latency. (C) Cosine similarity index average between-subject (left; calculated from half of the grid, excluding the diagonal) and within-subject site (right; calculated as the average of the diagonal of IPL/DLPFC, sham/DLPFC, and sham/IPL grids) pre and post removal of AEP components. (D) TEP/topography of all mid latency components contributing more than 28% variance in mid latency window in sham stimulation condition (N = 16) from full group analysis.

