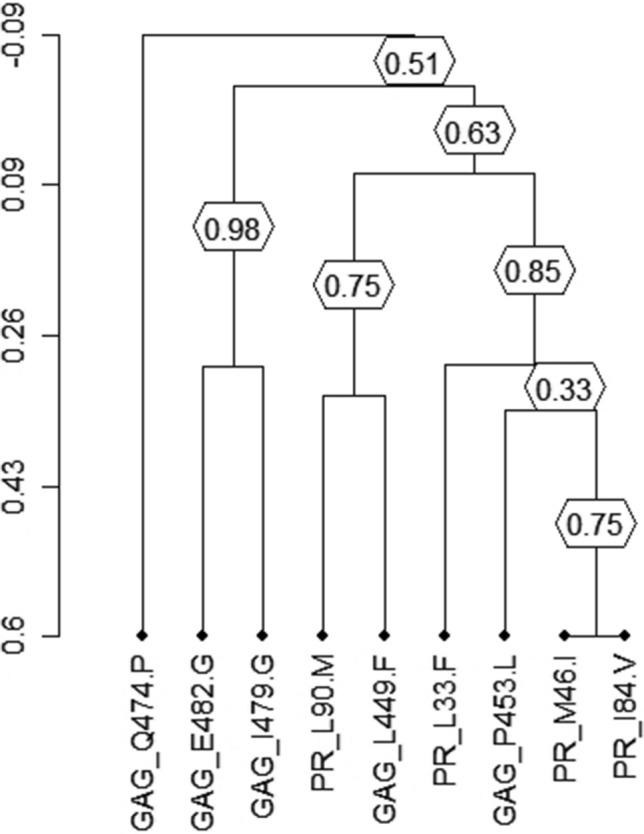
Figure 4.

Clusters of correlated mutations. Dendrogram obtained from average linkage hierarchical agglomerative clustering, showing clusters of Gag mutations and protease resistance mutations. The length of branches reflects distances between mutations in the original distance matrix. Bootstrap values, indicating the significance of clusters (≥ 0.2), are reported in the boxes. Gag mutations start with ‘Gag’ and protease mutations with ‘PR’.
