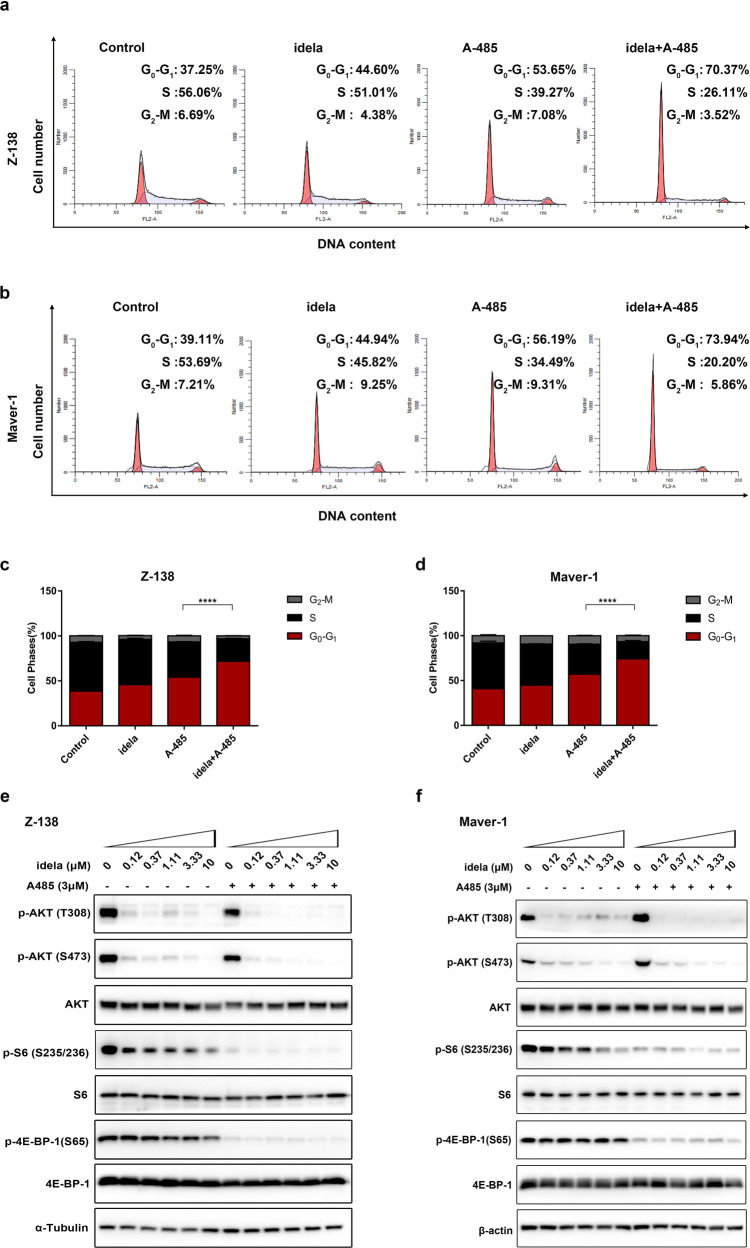
Fig. 2. Combination treatment with idelalisib and A-485 caused G1/S arrest and coinhibition of PI3K signaling in MCL cells.
a, b Cells were treated with DMSO (control), idelalisib (10 μM), A-485 (0.5 μM), or a combination of two compounds for 72 h. c, d The percentages of cells in G1, S, and G2 phases were quantified. The data shown here are the mean ± SD of three independent experiments. ****P < 0.0001. e, f Immunoblotting of phosphorylation changes in PI3K pathway molecules. Z-138 and Maver-1 cells treated with the indicated doses of idelalisib were exposed to A-485 for 24 h. α-Tubulin and β-actin were used as controls.

