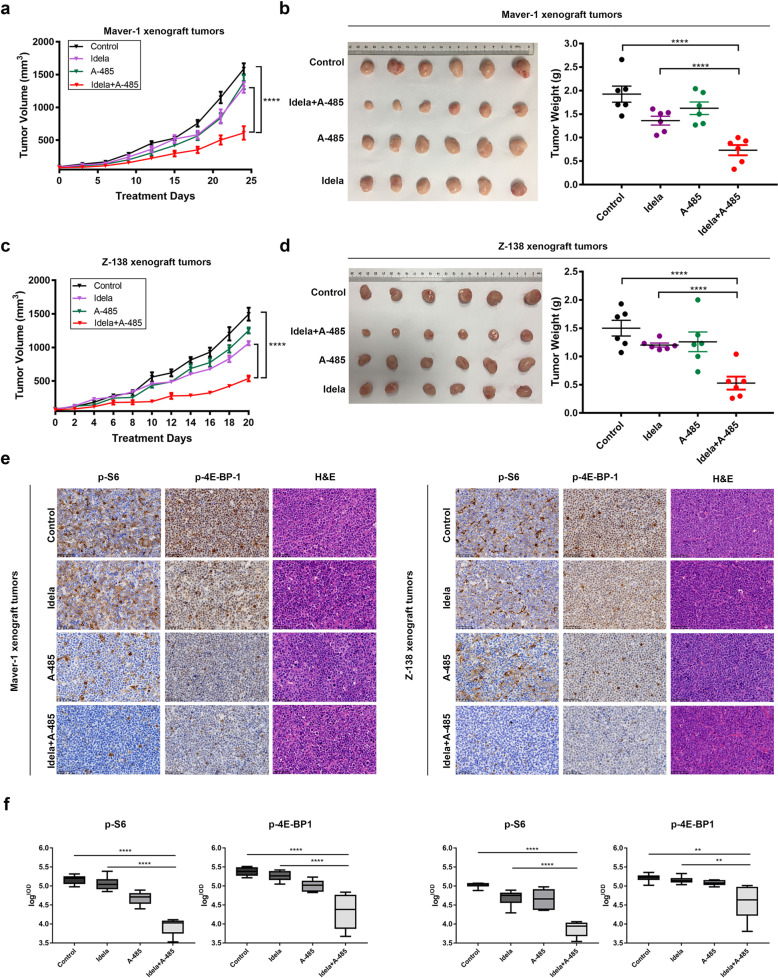
Fig. 3. Antitumor efficiency of p300/CBP and PI3Kδ inhibition in vivo.
a Tumor growth curve in the Maver-1 model. Mice were treated with A-485 via i.p. administration of 50 mg/kg, idelalisib via p.o. administration of 30 mg/kg, or the indicated combination at the same doses daily for 24 days. b Representative Maver-1 xenografts harvested from mice. Tumor samples were weighed after the mice were sacrificed. c Tumor growth curve in the Z-138 model. Mice were treated with A-485 via i.p. administration of 50 mg/kg, idelalisib via p.o. administration of 30 mg/kg, or the indicated combination at the same doses daily for 21 days. d Representative Z-138 xenografts harvested from mice. Tumor samples were weighed after the mice were sacrificed. e Representative IHC image of molecular changes in resected tumor tissues. Tumor samples as described were collected 8 h after the last dosing, and intratumoral molecular changes were detected using immunohistochemical analysis. Scale bar, 50 μm. f Logarithmic summed IOD value of protein expression in the IHC image. The error bars indicate the SEMs (n = 6 mice per group). **P < 0.01; ****P < 0.0001.

