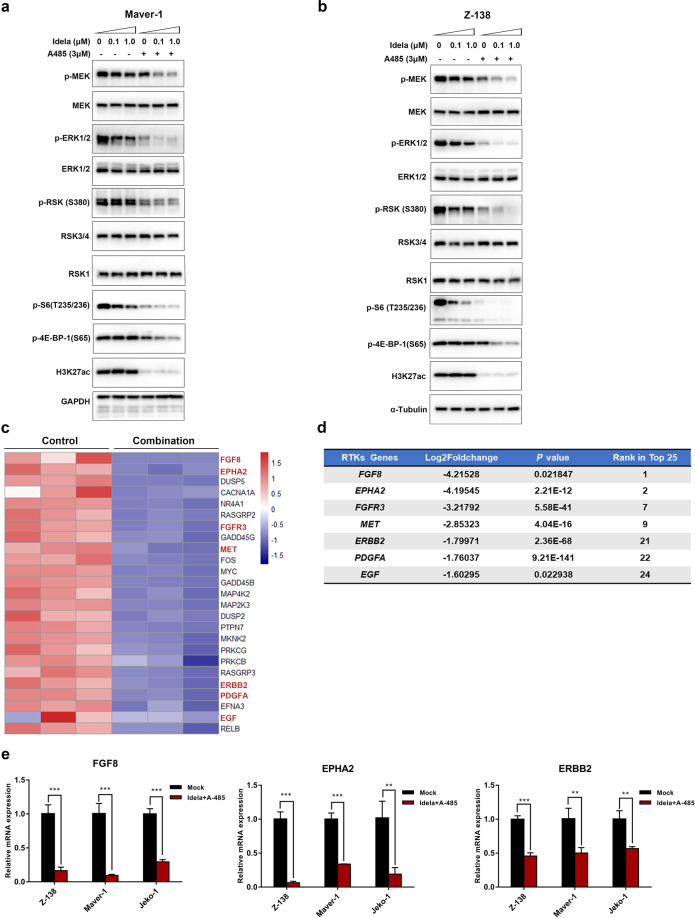
Fig. 5. The ERK-RSK-mTOR axis and upstream RTKs were inhibited by the combination treatment.
a, b Pathway phosphorylation changes. Z-138 and Maver-1 cells treated with the indicated doses of idelalisib were exposed to 3 μM A-485 for 24 h. Phosphorylation changes in ERK-RSK-mTOR signaling molecules were detected by immunoblotting. α-Tubulin and GAPDH were used as controls. c Heat map showing the 25 most significantly downregulated genes in the MAPK pathway. Hub genes are highlighted in red. d Table of RTK-related genes among the top 25 genes. Seven of the 25 genes are listed in the table and ranked according to the log2 (fold change) value. e RT-qPCR analysis was conducted to validate the repression of hub genes. Z-138, Maver-1, and Jeko-1 cells were treated with 3 μM A-485 and 1 μM idelalisib for 8 h. The data are shown as the mean ± SD of three independent experiments. **P < 0.01; ***P < 0.001.

