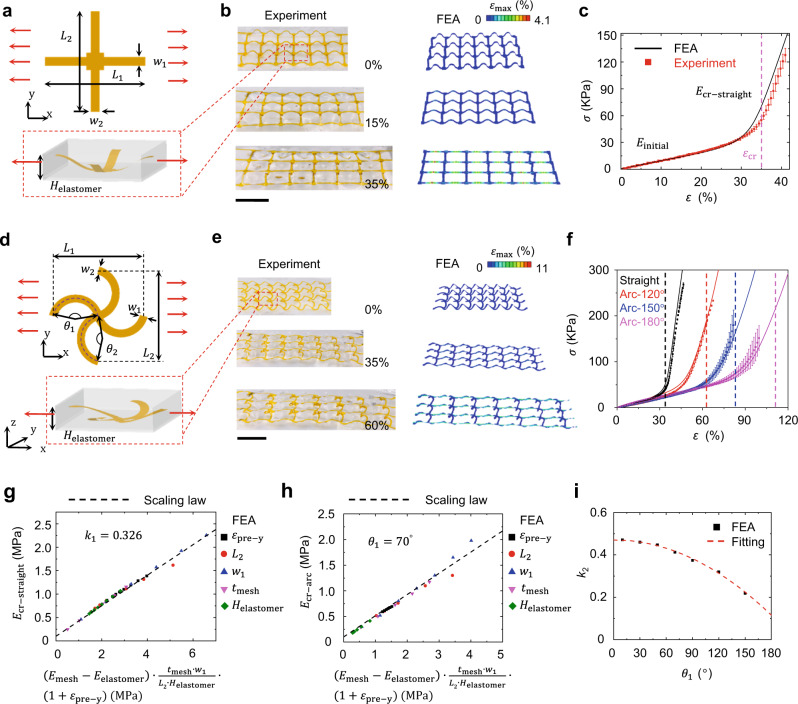
Fig. 2. Nonlinear mechanical responses and basic design rules of elastomer composites based on mechanically assembled 3D skeletons.
a Schematic illustrations of geometric parameters associated with the unit cell of 2D precursor, 3D skeleton, and elastomer encapsulation for the straight-line design. b Optical images of one straight-line-based composite and corresponding finite element analysis (FEA) simulations upon uniaxial stretching along the x-axis. Scale bar: 1 cm. c Experimental and FEA results of J-shaped stress (σ)-strain (ɛ) curves for one straight-line-based composite. d Scheme of geometric parameters associated with the unit cell of 2D precursor, 3D skeleton, and elastomer encapsulation for the arc-line design. e Optical images of one arc-line-based composite and corresponding FEA results with maximum principal strain distributions of 3D skeleton upon uniaxial stretching (arc angle: 120°) along the x-axis. Scale bar: 1 cm. f Experimental and FEA results of stress-strain curves for one straight-line design and three arc-line designs with different arc angles. Black, red, blue, and pink colour lines refer to the straight-line design and three arc-line designs with arc angles of 120°, 150°, and 180°, respectively. Dash lines refer to critical strains (35%, 63%, 83%, and 112% for the black, red, blue and pink lines, respectively) for the four curves. g The scaling law of versus for the straight-line design. h The scaling law of versus for the arc-line design with 70°. i The relationship between the parameters and from FEA results and fitting. The color bars in FEA results represent maximum principal strain distributions of 3D skeletons. Here, , , , , , , , , , , , , , and denote the ribbon widths along x and y directions, lengths of unit cells along x and y directions, thickness of elastomer composites, arc angles along x and y directions, elastic moduli of skeleton materials and encapsulation elastomers, thickness of skeleton ribbons, prestrain along y-direction used for 3D assembly, tangential moduli at critical strains for straight-line and arc-line designs, and fitting parameters of straight-line and arc-line designs, respectively. Error bars in c and f are determined from three samples.

