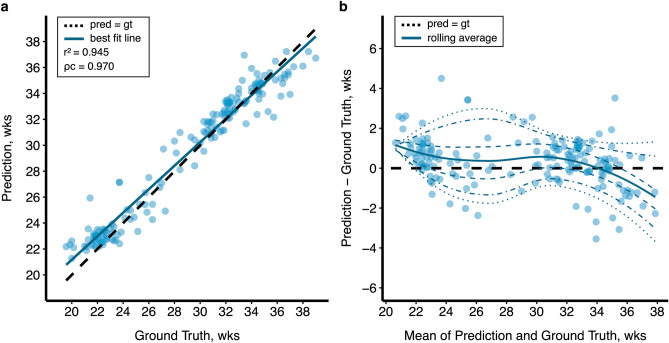
Figure 1.
Regression performance of an attention-guided multi-plane ResNet-50 model. Model performance of the highest-scoring architecture visualized above. (a) Correlation between predicted brain age and ground truth (R2 = 0.945) is represented by the line of best fit (blue). The dashed line is the ideal regression, where prediction equals true age. (b) Differences between predictions and ground truth are shown on the modified Bland–Altman plot. Corresponding 5%, 10th, 25th, 50th, 75th, 90th, and 95th quantile curves based on local piecewise regression analysis are drawn.

