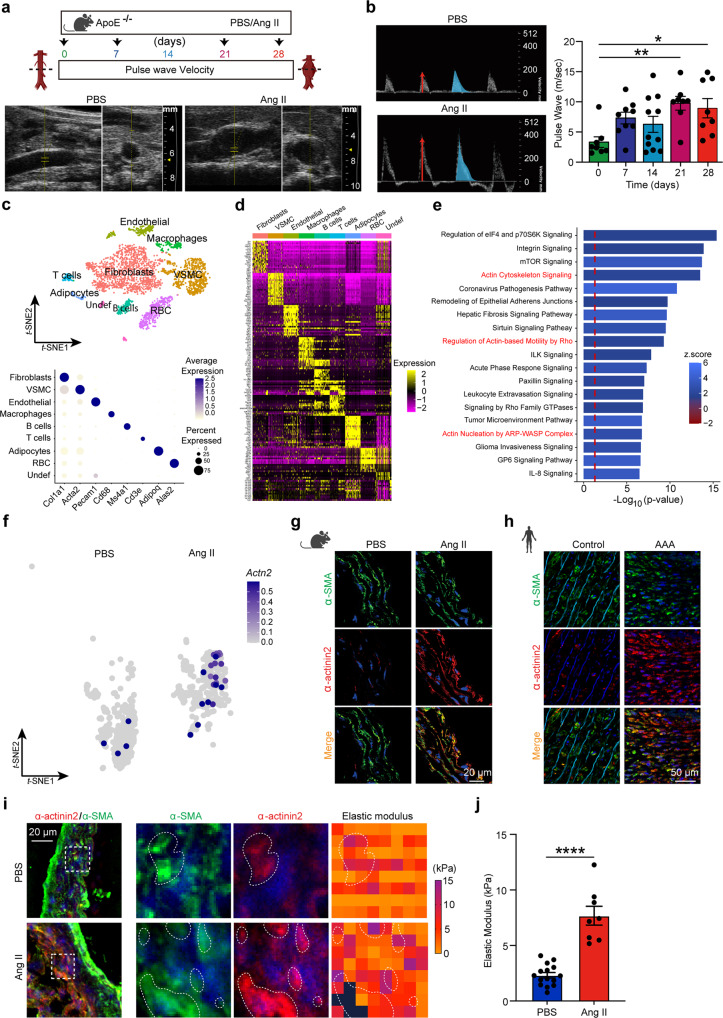
Fig. 1. Increased CSK crosslinking in VSMC of the stiffened aortic tissue in AAA.
a Schematic representation of experimental protocol of PBS (control) or Angiotensin II (Ang II) in mice with timeline of pulse wave velocity (PWV) measurements. b Representative images of ultrasonography 2D scan images of peak systolic velocity (red arrow), global pulse wave curve (blue curve), and PWV quantification of mice exposed to Ang II for days as indicated. n = 8 mice for day 0, n = 9 for day 7, n = 11 for day 14, n = 8 for day 21, and n = 8 for day 28. One-way ANOVA followed by Dunnett’s multiple comparisons test. *P = 0.0136 and **P = 0.0041. Data are presented as mean values ± SEM. c t-distributed stochastic neighbor embedding (t-SNE) plot of single-cell RNA-sequencing of mice aortas (n = 4–5 per group). Cell clusters are annotated, top panel. Dot plot representation showing average expression and percentage of expression in the cluster of the markers used for cluster identification, lower panel. VSMC vascular smooth muscle cells, RBC red blood cells. d Heatmap of top differentially expressed transcripts of each cell clusters. e Pathway analysis of differentially expressed genes in AngII vs PBS VSMC. f t-SNE distribution of Actn2 mRNA (log2 expression) within the VSMC cluster and across conditions, as indicated. g, h Immunofluorescence (IF) staining of α-actinin2 (red) and α-SMA (green) in murine (g) and human (h). i Representative IF merged image of α-SMA (green) and α-actinin2 (red) in aortic section of mice (left panel, dashed box shows area of atomic force microscopy (AFM) measurement) and heatmap representation of elastic modulus captured by AFM (right panel, dotted lines demark regions enriched in α-actinin2 with maximum force). Nuclei are stained with DAPI (blue) in all IF images. j Quantification of the elastic modulus of aortic sections as indicated. n = 15 square regions in at least three aortic sections for PBS and n = 8 square regions in at least three aortic sections for Ang II. Two-sided unpaired t-test. ****P < 0.0001. Data are presented as mean values ± SEM. Tissue sections in g, h, and i were transversal sections. Mouse, human, and aorta icons in a, g, and h are created with BioRender.com. Source data are provided as a Source Data file.

