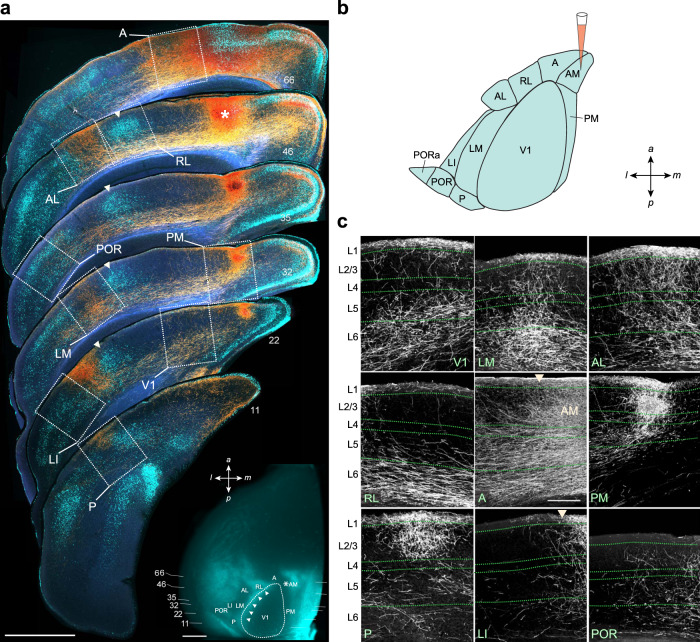
Fig. 1. Identification of visual areas.
a Rostrocaudal series of coronal sections of the left hemisphere in which AM was injected with BDA. Dark-field images of anterogradely labeled axonal projections (yellow/orange) to distinct visual areas (white outlined boxes). Numbers denote the coronal plane corresponding to the respective rostrocaudal location shown in the inset. Fluorescent images of retrogradely labeled callosal neurons (cyan), after injection of bisbenzimide into the right hemisphere, aid in the identification of areal borders. For example, the column of callosal neurons (arrowheads in coronal sections) corresponds to the band shown in the inset (arrowheads). Inset, In situ image of left hemisphere, before coronal sectioning, showing retrogradely labeled callosally projecting neurons (cyan). Asterisk denotes injection site in AM. White arrowheads indicate a band of callosal neurons that form the boundary between V1 and an acalossal zone that includes LM, LI, and AL. Horizontal lines and numbers denote the coronal planes shown above. Scale bars, 1 mm. b Diagram of visual areas and a BDA injection into AM; a anterior, m medial, p posterior, l lateral. c High magnification images of regions within white boxes in Fig. 1a. Axonal projections from AM target the other nine areas with varying strengths and laminar patters, and are observed in all six layers. Arrowhead in the LI panel denotes boundary between LI and LM. Arrowhead in the A panel denotes boundary between A and AM. Scale bar, 200 µm.

