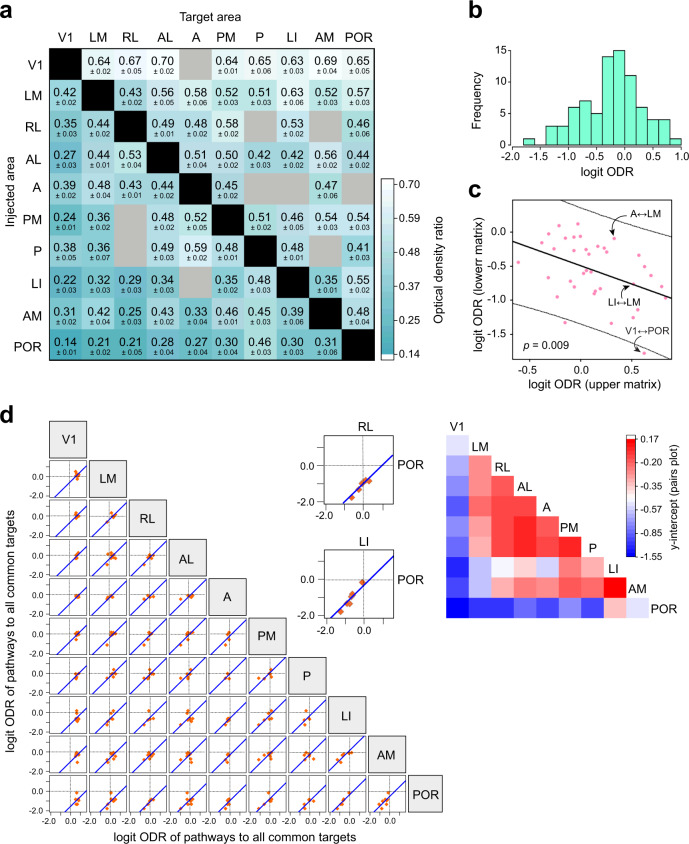
Fig. 3. Mouse cortical network exhibits hierarchical features.
a 10 × 10 connection matrix of interareal connections between the 10 visual areas. Each block shows the ODR for the respective pathway in which the source and target areas are respectively denoted on the left of each row and the top of each column. Gray blocks represent pathways that could not be analyzed due to weak axonal projections in the target area. b Distribution of logit transformed values of the ODRs for all 80 pathways. A logit ODR value of zero indicates an ODR of 0.5. c Logit ODR for each pathway plotted against that of its reciprocal counterpart for all 74 pathways that have a dense reciprocal connection (see Fig. 3a). ‘Upper matrix’ and ‘lower matrix’ refer respectively to the ODR values in the upper/right and lower/left triangular halves of the matrix in Fig. 3a. The fit shows a significant negative association (slope = −0.53, p = 0.009, F-test, F-statistic: 7.54 on 1 and 35 degrees of freedom) indicating that the more FF a pathway is in one direction, the more FB is the reciprocal pathway. The identities of three representative reciprocal connections in the scatterplot are shown to illustrate the variation in asymmetry of ODRs for reciprocally connected areas. d. Scatterplots showing the correlation of logit ODR values in all shared targets of any two injected areas. The horizontal axis of each plot corresponds to the logit ODR of the pathway originating in the area indicated at the top of each column, and the vertical axis corresponds to the logit ODR of the pathway originating in the area indicated at the right of each row. Thus, each orange data point plots against each other the logit ODRs for pathways that terminate in a common target area for the corresponding two injected areas. Areas that exhibited weak or absent projections from one of the two injected areas (gray blocks in Fig. 3a) were excluded. Dotted lines, coordinate axes. A line of unit slope (blue) that best fit the points is plotted in each graph, and the absolute value of the y-intercept of this unit line provides a measure for hierarchical distance between the two injected areas. Two example graphs are shown at higher magnification with the injected areas indicated. Note that the absolute value of the y-intercept in the graph plotting pathways originating in RL and POR (y-intercept, −1.04) is greater than that in the graph for pathways from LI and POR (y-intercept, −0.33). This indicates that RL and POR are more hierarchically distant than are LI and POR when only projections emerging from these three areas are considered. The y-intercepts of each graph are plotted as a heat map on the right.

