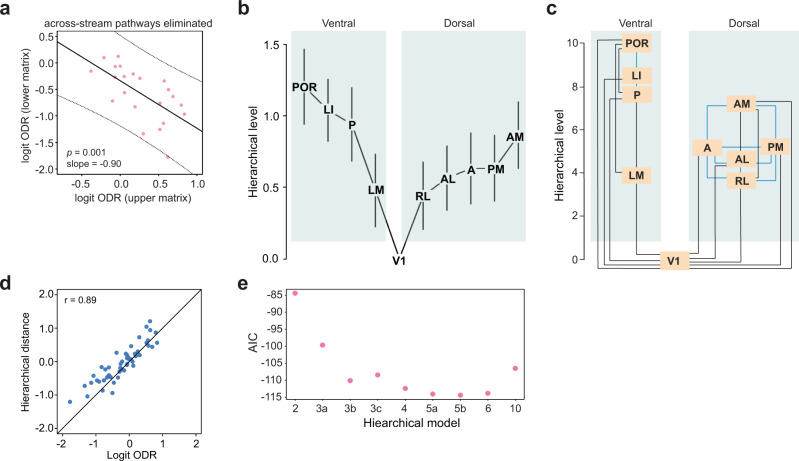
Fig. 5. Construction of hierarchy after separation of dorsal and ventral streams.
a When pathways connecting areas belonging to the two different streams (dorsal and ventral) were eliminated from analysis, the plot of ODR values in one direction against that in the reciprocal direction shows a steeper slope compared to when all pathways are included (Fig. 3c; p = 0.009 for comparison between the two slopes, ANCOVA). b Estimated hierarchical levels obtained using a beta regression model after elimination of cross-stream pathways. Hierarchical level value of V1 was set at 0, and differences between any two hierarchical level values best predict the ODR for the pathways connecting the respective areas. c Hierarchical levels similar to Fig. 5b, but scaled to values between 1 and 10. Black lines interconnect pairs of areas that show a significant difference between their respective hierarchical levels (p < 0.05, two-sided Wald test for multiple coefficients). Blue lines interconnect areal pairs that lack a significant difference between their respective hierarchical levels. d Within-stream hierarchical distances estimated by the beta regression model plotted against the logit of the measured ODRs show a high goodness of fit (r = 0.90). e The AIC values for nine models in which different combinations of areas were constrained to be part of the same level, and the beta regression fit performed for each such model. The lowest AIC value occurs for the model in which the network is organized into five levels (V1, RL/LM, AL/A/PM, AM/P, LI/POR; model 5b), indicating this to be the model with the best predictive power. Hierarchical models: 2, two levels (V1, all higher-order areas merged into a second level); 3a, three levels (V1, RL/LM, all higher areas merged into a third level); 3b, three levels (V1, RL–PM, and AM–POR); 3c, three levels (V1, RL–LI, POR); 4, four levels (V1, RL–PM, AM/P/LI, POR); 5a, five levels (V1, RL/LM, AL/A/PM, AM/P/LI, POR); 6, six levels (V1, RL/LM, AL/A/PM, AM/P, LI, POR); and 10, all ten areas at different levels.

