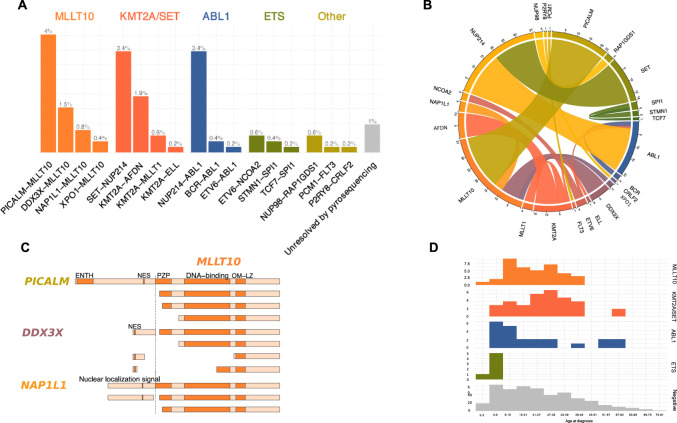
Fig. 1. Identified fusion transcripts and incidence.
A Histogram of identified transcripts, assigned to fusion groups. On top of each bars the percentage of all cases. PICALM-MLLT10 (4%), SET-NUP214 (3.4%), and NUP214-ABL1 (3.4%) are the most recurrent. B Circos plot representing the fusion transcripts. C Schematic representation of MLLT10 fused polypeptide chains with relevant domains. OM-LZ and nuclear addressing signals are always conserved. D Histograms of incidence of cases by age classes and fusion groups (absolute count on y axis). ETS fusion group is constituted with only pediatric cases. ENTH epsin N-terminal homology, NES nuclear export domain, PZP pregnancy zone protein.

