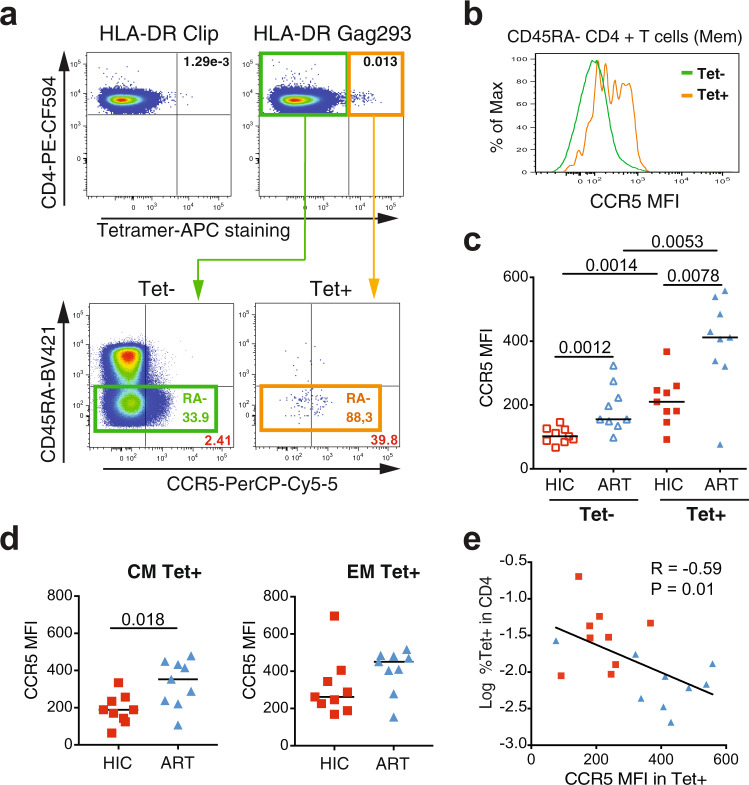
Fig. 3. Low CCR5 expression correlates with the persistence of Gag293-specific CD4 + T cells.
a Example of CCR5 staining in Gag293-specific (Tet+) and non-specific (Tet−) controller CD4 + T cells. b Comparison of the CCR5 MFI in the Tet+ and Tet− populations shown in a, after gating in the CD45RA− memory (Mem) population. c Comparison of CCR5 MFI in the Tet+ and Tet− populations of controller (HIC) and treated patient (ART) Mem CD4 + T cells. d Comparison of CCR5 expression in the central memory (CM) and effector memory (EM) subsets of Tet+ cells. Significant differences between medians computed with the Mann-Whitney test are reported in c–d. e Inverse correlation between the frequency of Gag293-specific Tet+ cells in CD4 + T cells and CCR5 expression in Mem Tet+ cells. The Spearman linear correlation coefficient R and the associated P-value are reported. HIC Tet+ red squares; ART Tet+ blue triangles.

