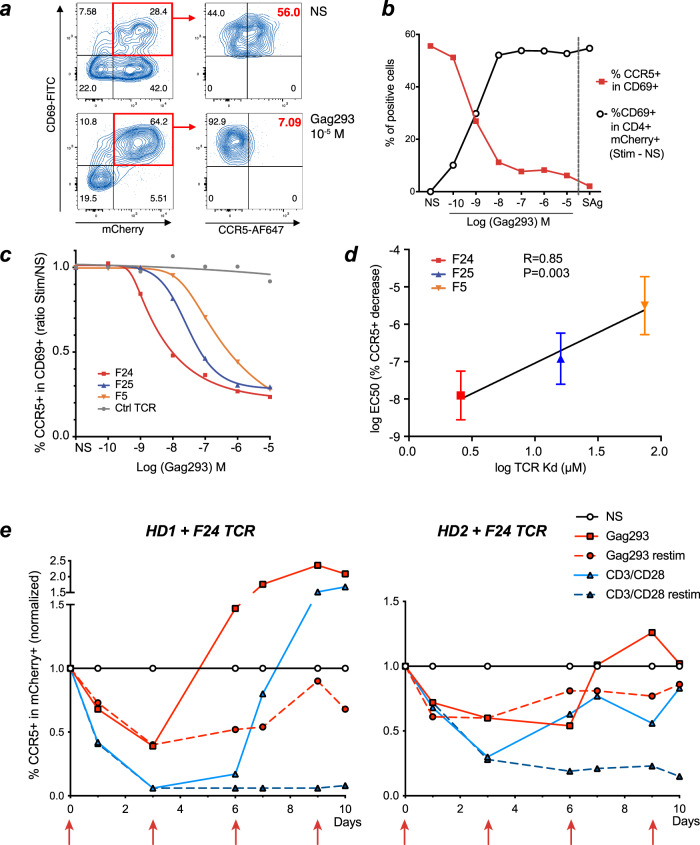
Fig. 8. Strong TCR signals induce CCR5 downregulation.
a–d Analysis of CCR5 downregulation in HD PBMC transduced with Gag293-specific TCRs and activated with Gag293-loaded APC. a Gating strategy: TCR-dependent activation was measured by CD69 induction in TCR-transduced (mCherry+) CD4 + T cells (left). CCR5 downregulation was measured in activated mCherry+ CD69 + CD4 + T cells (right). NS Non-stimulated. b Example of quantitation of T cell activation (%CD69 + in Stim - NS Black curve) and of CCR5 down-regulation (%CCR5+ in CD69+) in TCR F24-transduced PBMC, in function of Gag293 concentration. Superantigens (SAg) were used as positive control. c Analysis of CCR5 downregulation as in B, for PBMC transduced with 3 Gag293-specific TCRs of increasing affinity (F5 < F24 < F24) or with a control flu-specific TCR (Ctrl) in an HLA-DR15 context. One representative experiment out of n = 3 is shown. The % CCR5 + cells in CD69 + mCherry+ CD4 + T cells is normalized to that measured in the unstimulated condition (NS). d Correlation between TCR affinity (Kd) for the Gag293/HLA-DR15 complex and the Gag293 EC50 concentration for CCR5 downregulation (as determined in c). Means ±SD are shown for n = 3 experiments. The linear regression coefficient R and associated P-value for the slope being significantly ≠ 0 are reported. e Kinetics of CCR5 downregulation in TCR transduced CD4 + T cells upon antigenic stimulation. TCR-transduced CD4 + T cells (mCherry+ CD4 +) were monitored for CCR5 expression after stimulation at day 0 with either the cognate peptide (Gag293; solid red lines) or anti-CD3/anti-CD28 coated beads (CD3/CD28; solid blue lines). Kinetics are shown in transduced cells of n = 2 healthy donors, HD1 (left), and HD2 (right). The proportion of CCR5 + cells as compared to the unstimulated condition (NS) is reported. In the “restim” conditions (dashed lines), cultures were restimulated at days 3, 6, and 9, as indicated by red vertical arrows.

