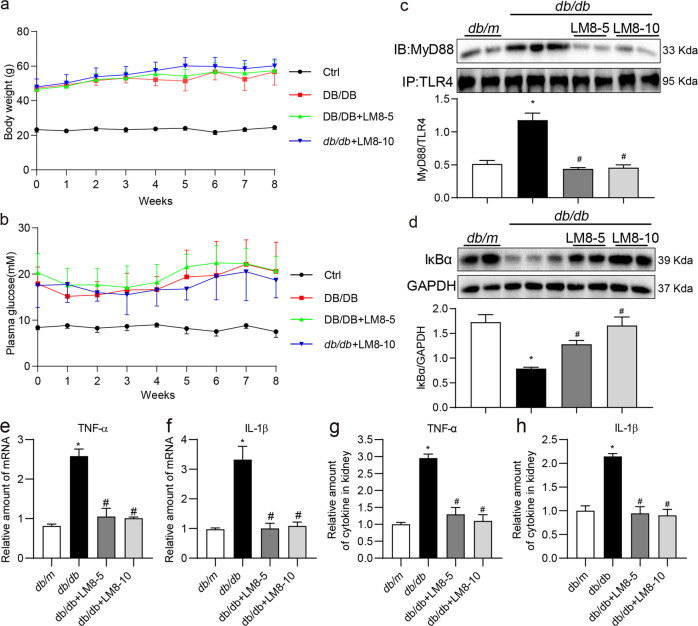
Fig. 6. LM8 prevents MyD88 activation and inflammatory responses in db/db mice.
Animal experiments were performed as described in “Methods” section. Body weights (a) and plasma glucose levels (b) were recorded weekly. Data are shown in mean ± SD. c The representative blots showed the co-precipitation analysis for TLR4-MyD88 complex in kidney samples. Lysates were immunoprecipitated using TLR4 antibody and probed for MyD88. Densitometric quantification is shown in the lower panel. d The representative blots showed IκBα protein levels in mouse kidneys detected by Western blot assay, with GAPDH as loading control. Densitometric quantification is shown in the lower panel. e, f mRNA levels of TNF-α and IL-1β in the kidney tissues were examined by real-time qPCR assay. β-Actin was used for normalization. g, h TNF-α and IL-1β protein levels in the kidney tissue lysates as detected by ELISA. db/m Control db/m group, db/db db/db T2DM mice, LM8-5 5 mg/kg LM8 treatment, LM8-10 10 mg/kg LM8 treatment; mean ± SEM; n = 7 per group; *P < 0.05 compared to db/m; #P < 0.05 compared to db/db.

