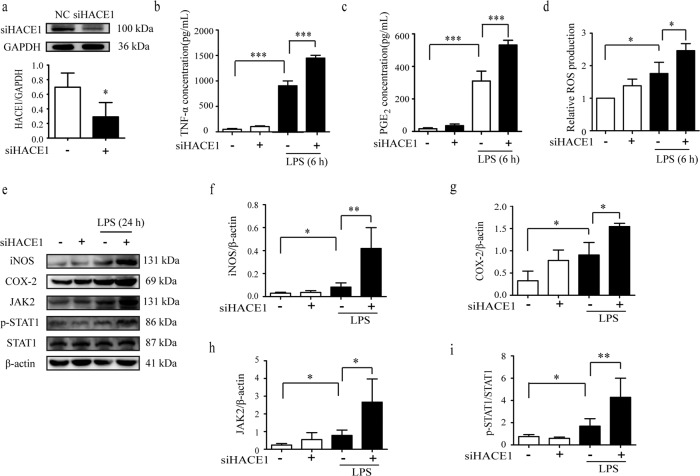
Fig. 1. HACE1 knockdown in BV2 cells exacerbated neuroinflammation.
a The expression of HACE1 following siRNA transfection was detected by Western blot. b The release of TNF-α production was measured by ELISA kit. c The release of PGE2 production was measured by ELISA kit. d The level of ROS was assayed using a fluorescence microplate reader. e–i The levels of expression of iNOS, COX-2, JAK2, p-STAT1 and STAT1 were analyzed by Western blot. The data was presented as mean ± SD, n = 3. *P < 0.05, **P < 0.01, ***P < 0.001.

