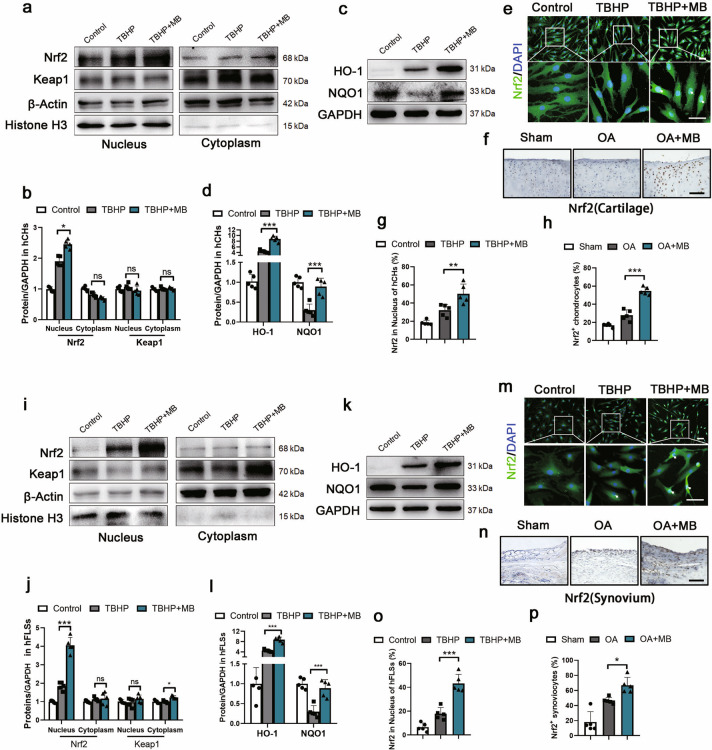
Fig. 3. MB increases the expression and nuclear translocation of Nrf2 in hCHs and hFLSs.
Representative Western blot results for nuclear and cytoplasmic expression of Nrf2 and Keap1 in hCHs and hFLSs after TBHP treatment and treatment with or without MB. b, j Quantification of Western blot data from a (b) and i (j). Representative Western blot results for HO-1 and NQO1 in hCHs and hFLSs after TBHP treatment and treatment with or without MB. Quantification of the Western blot data from c (d) and k (l). Immunofluorescence staining for Nrf2 in hCHs and hFLSs (green: Nrf2;blue: DAPI; scale bar: 100 μm). f, n Immunohistochemical staining for Nrf2 in the affected joint cartilage and synovium of rats (scale bar: 100 μm). Quantification of the immunofluorescence staining data from e (g) and m (o). h, p Quantification of the immunohistochemical staining data from f (h) and n (p). All data represent the mean± S.D. (n = 5). *P < 0.05, **P < 0.01, and ***P < 0.001.

