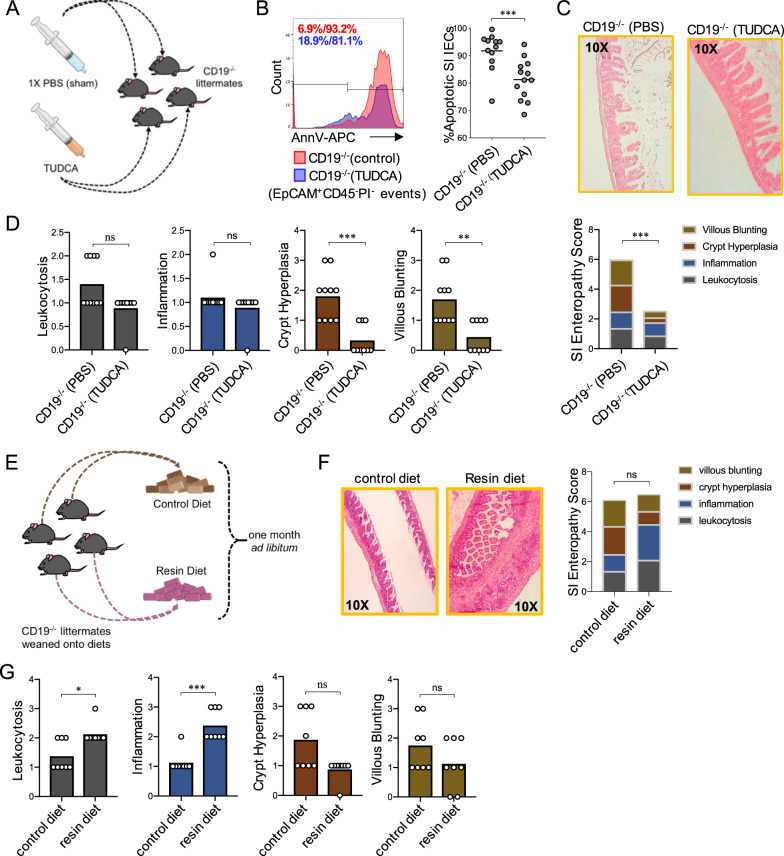
Fig. 4. Manipulation of BA availability alters severity of SI enteropathy.
A Schematic overview of oral TUDCA supplementation experiment. Syringe illustrations in (A) are image elements derived from BioRender.com. B Representative flow cytometry plots and comparison of the percentage of apoptotic IECs in vehicle (PBS) (n = 12) or TUDCA-treated (n = 13) CD19−/− mice are shown. Two-tailed unpaired Mann–Whitney U test; ***=p = 0.0009. C SI enteropathy scoring is shown for vehicle or TUDCA-treated CD19−/− mice. Two-tailed unpaired Mann–Whitney U test; ***=p = 0.0008. D Comparison of individual features of SI enteropathy between vehicle or TUDCA-treated CD19−/− mice are shown. Two-tailed unpaired Mann–Whitney U test; (leukocytosis), n = non-significant =p = 0.0542, (inflammation), ns = non-significant =p = 0.53, **=p = 0.003, ***=p = 0.0008. E Schematic overview of cholestyramine diet exposure experiment. Mouse chow illustrations in (E) are image elements derived from BioRender.com. F Results of SI enteropathy scoring are shown for CD19−/− mice exposed to control versus resin diet. Two-tailed unpaired Mann–Whitney U test; ns = non-significant =p = 0.66. G Comparison of individual features of SI enteropathy between CD19−/− mice exposed to control versus resin diet are shown. Two-tailed unpaired Mann–Whitney U test; (crypt hyperplasia), ns=non-significant=p = 0.0513, (villous blunting), ns = non-significant =p = 0.27, *=p = 0.0.02, ***=p < 0.0009. A–D Data representative of three replicate experiments. E–G Data representative of two replicate experiments.

