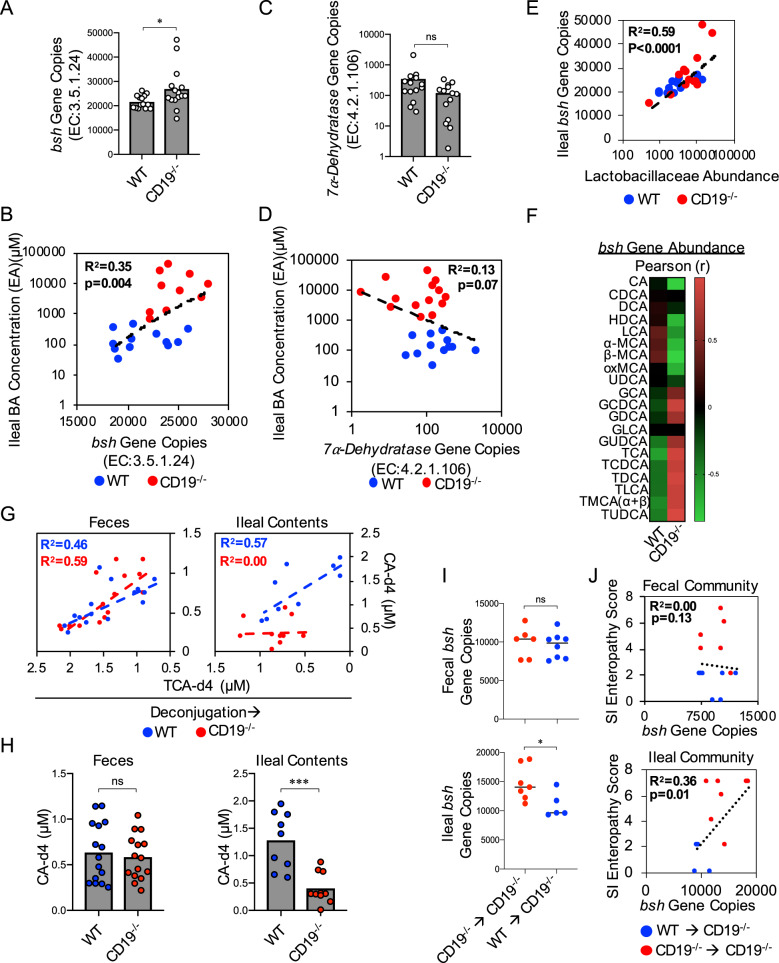
Fig. 6. Ileal bsh activity is perturbed in CD19−/− mice.
A Total bsh (EC:3.5.1.24) gene abundance in WT and CD19−/− mice is shown. Two-tailed unpaired Student’s t-test; *=p = 0.04. B Correlation between bsh gene abundance and ileal BA concentrations is shown. Two-tailed one-way ANOVA, Fstat(1,20) = 10.66, p = 0.004. C Total 7α-dehydratase (EC:4.2.1.106) gene copies in WT and CD19−/− mice are shown. Two-tailed unpaired Student’s t-test; ns = p = 0.0651. D Correlation between 7α-dehydratase gene abundance and ileal BA concentrations is shown. Two-tailed one-way ANOVA, Fstat(1,20) = 0.13, p = ns. E Correlation between Lactobacillaceae abundance and bsh gene abundance is shown. Two-tailed one-way ANOVA, Fstat(1,23) = 33.48, p < 0.0001. F Heatmaps summarizing descriptive statistics (Pearson r-coefficient and r-squared) of relationship between ileal bacterial bsh gene abundance and specific BA species are shown. Data representative of two replicate experiments. G Correlation between TCA-d4 and CA-d4 abundance (μM) in fecal protein extracts (left panel) and ileal content protein extracts (right panel) from WT and CD19−/− mice. Two-tailed one-way ANOVA (WT fecal protein extracts), Fstat(1,13) = 18.71, p = 0.0008. Two-tailed one-way ANOVA (CD19−/− fecal protein extracts), Fstat(1,13) = 11.04, p = 0.006. Two-tailed one-way ANOVA (WT ileal protein extracts), Fstat(1,7) = 9.186, p = 0.02. Two-tailed one-way ANOVA (CD19−/− ileal protein extracts), Fstat(1,8) = 0.0006, p = 0.98. H Total abundance of deconjugated CA-d4 in fecal and ileal content protein extracts from WT and CD19−/− mice. Two-tailed unpaired Student’s t-test; ns = non-significant =p = 0.63, ***=p = 0.0002. I Total bsh gene copies in feces and ileal contents of CD19−/− mice administered B cells from CD19−/− or WT mice. Two-tailed unpaired Student’s t-test; ns = non-significant =p = 0.68, *=p = 0.04. J Correlation between SI enteropathy and bsh gene copies in feces or ileal contents of CD19−/− mice administered B cells from CD19−/− or WT mice. Two-tailed one-way ANOVA (feces), Fstat(1,13) = 0.13, p = ns. Two-tailed one-way ANOVA (ileal contents), Fstat(1,10) = 7.61, p = 0.01. A–E Data representative of three replicate experiments. G, H Data representative of two replicate experiments. I, J Data representative of two replicate experiments.

