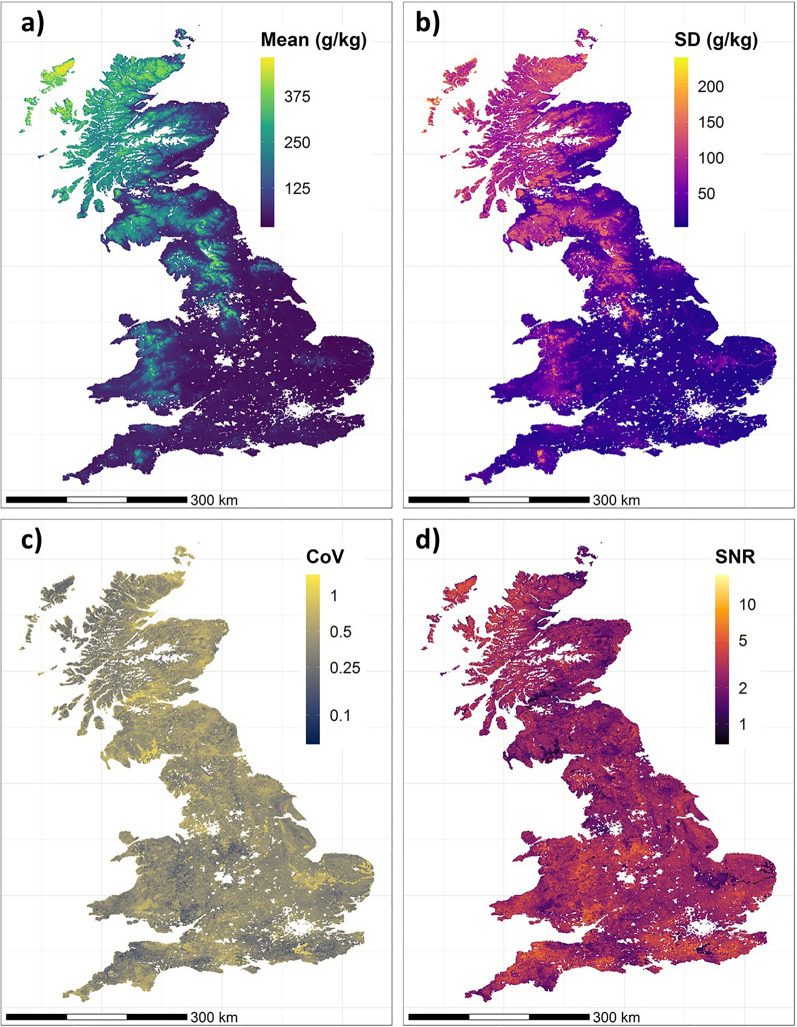
Figure 1.
Maps of the (a) mean topsoil SOC concentrations of all eight maps; (b) standard deviations of the mean (SD); (c) coefficient of variation values (standard deviation/mean); and (d) the signal to noise ratios (the reciprocal of the coefficient of variation i.e. mean/standard deviation). Note here that statistics were calculated after each of the 8 maps were modified to harmonise them to a common spatial extent, resolution and units of SOC concentration. Values are calculated only for those 1 km grid cells that contain data from all the topsoil SOC concentration maps. White areas indicate where there are no data for at least one of the maps, including urban areas and littoral broad habitats with little topsoil and parts of Scotland (excluded from CSGB-AIC due to the low spatial representation of CS 2007 points in montane broad habitats).

