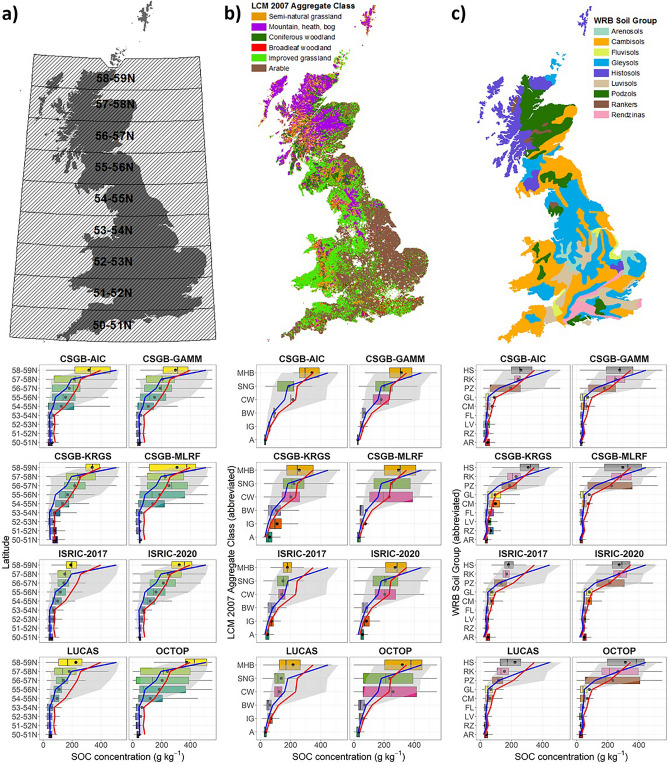
Figure 4.
Topsoil SOC concentration distributions at the level of smaller-scale geographical units representing major environmental covariates, including at (a) each 1-degree latitude interval (excluding Orkney and Shetland due to the limited spatial coverage) to represent climate; (b) Land Cover Map (LCM) 200741 Aggregate Class to incorporate effects of land management and organisms; and (c) the SoilGrids250m version 2 predicted major soil types, based on the World Reference Base (WRB) map from FAO/UNESCO42 to incorporate physical soil properties such as parent material. Boxplots are the topsoil SOC distribution modelled in all grid cells at each latitude interval for each of the eight maps (black circles are the means). The grey area is the IQR of the CS 2007 topsoil SOC distribution, and the solid blue and red lines denote the median and mean CS 2007 topsoil SOC values, respectively.

