
Figure 2.
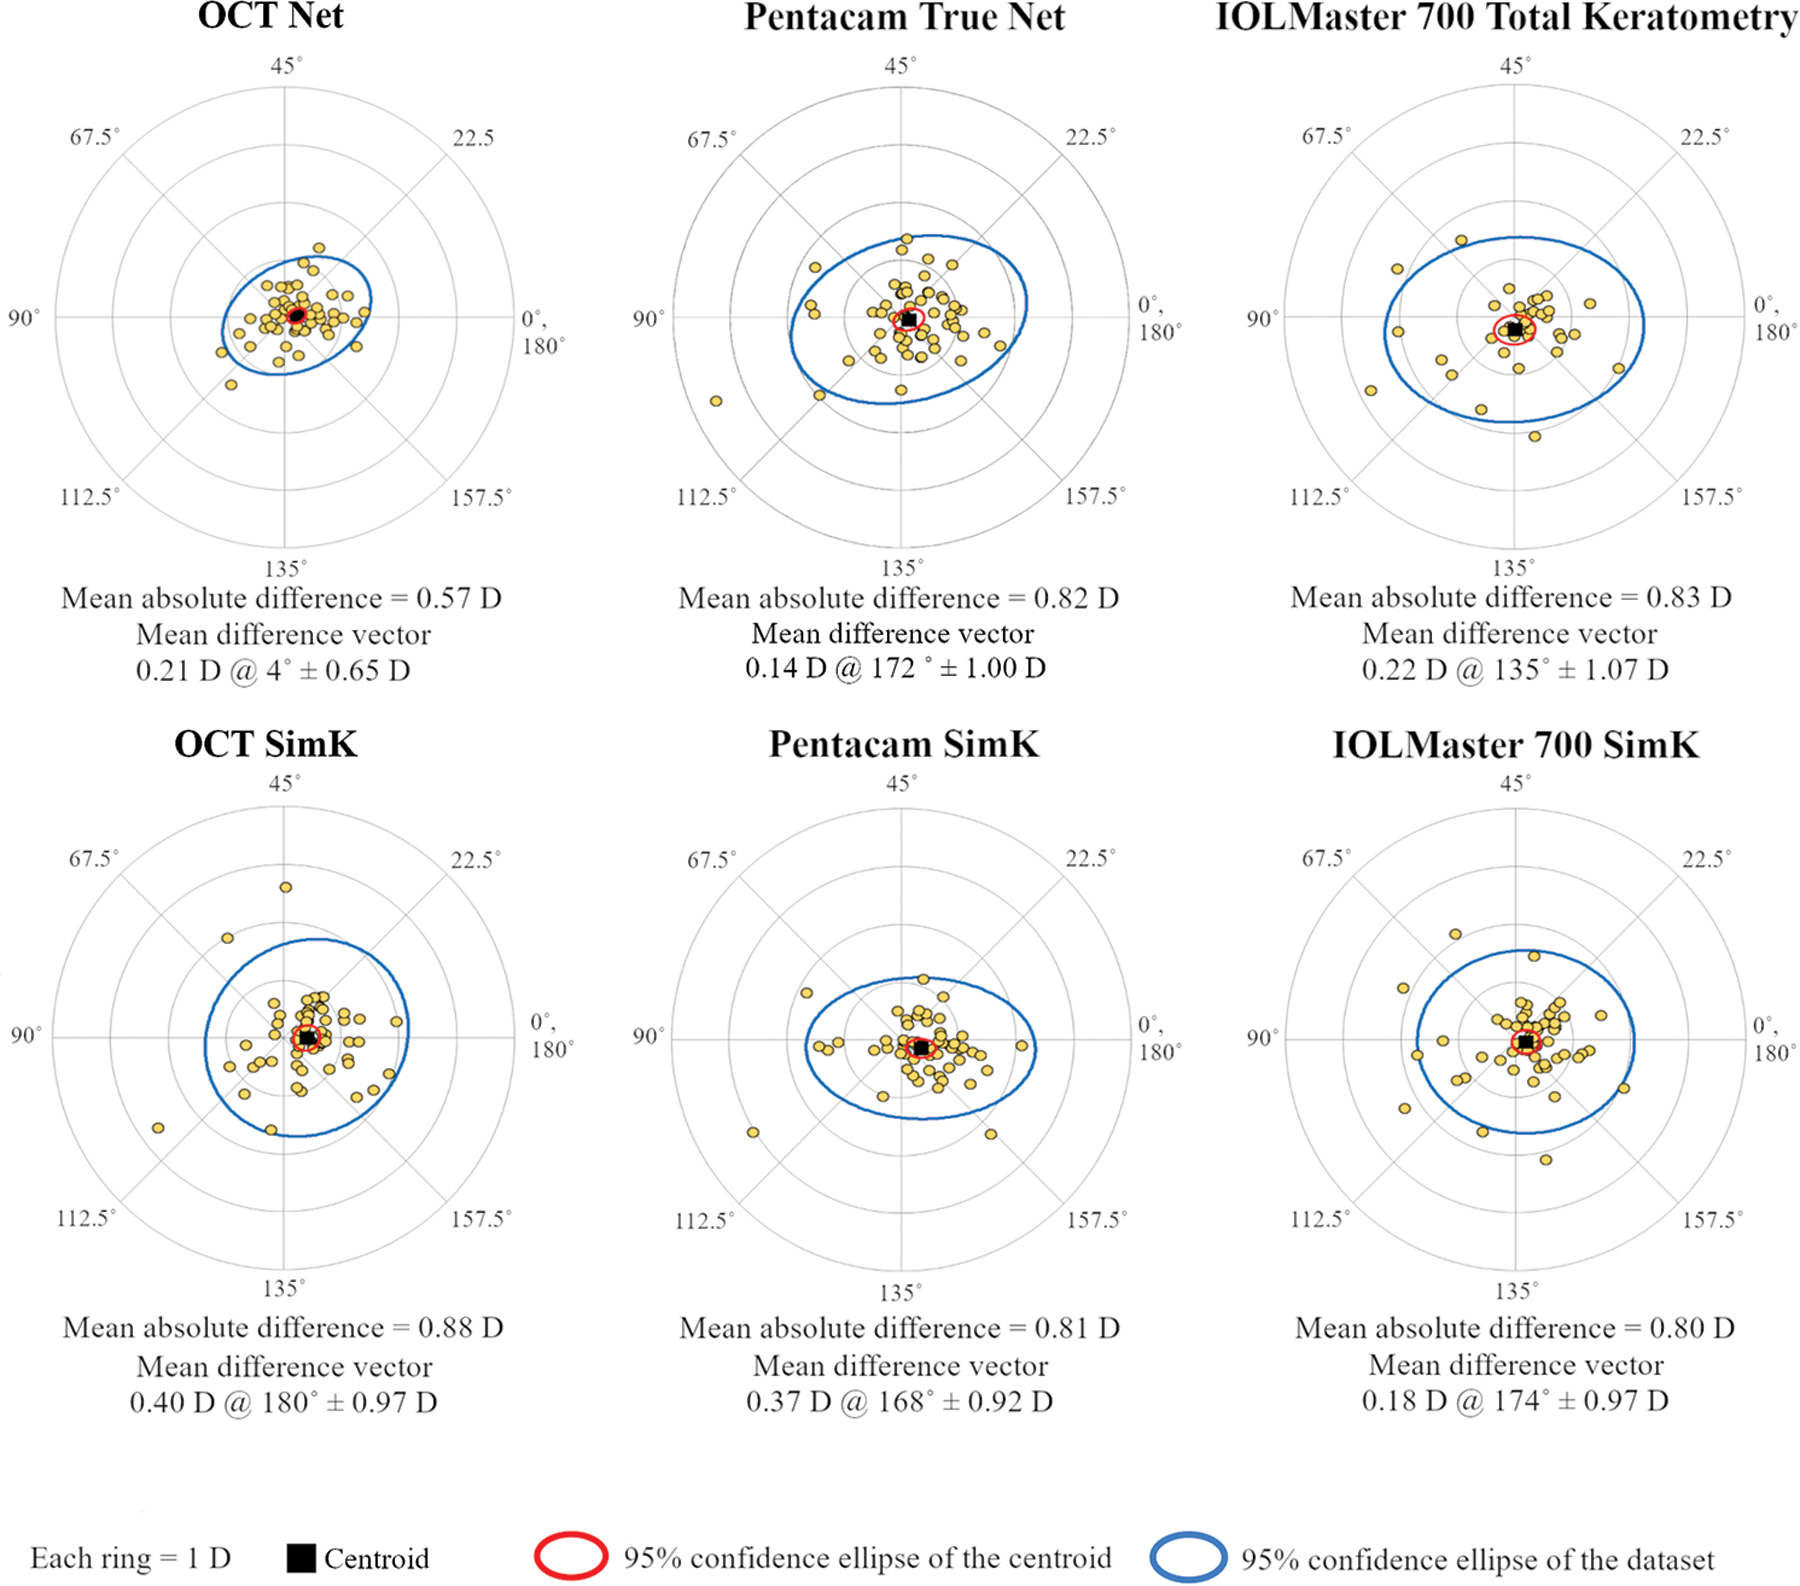
Double-angle plots showing the astigmatism difference vectors between manifest refraction and corneal astigmatism measurements by OCT, Pentacam HR, and IOLMaster 700. The OCT measurements shown here are centered on the corneal vertex. The mean absolute difference between corneal astigmatism and manifest refraction and the mean difference vector (centroid) are displayed under each double-angle plot.