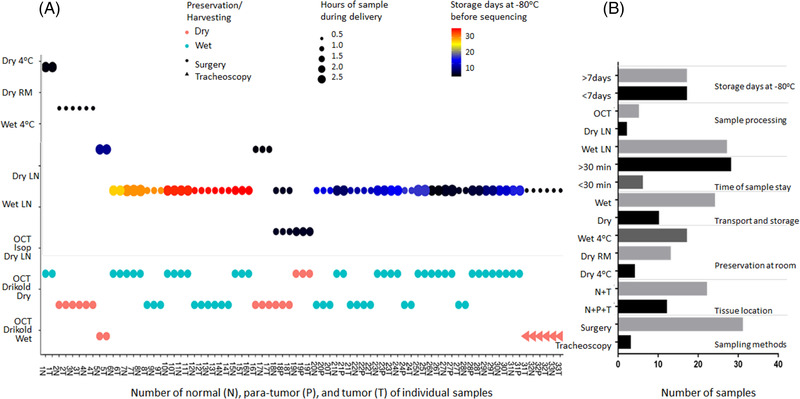
FIGURE 3.

The collected and processed information for each sample. (A) Details of each tissue handling: the horizontal axis shows the patient number and indicates the tissue locations, the vertical axis shows different preservation methods at operation room and different sample processing methods, red and green, respectively, represent dry and wet condition in transport and storage, dots and triangles represent different sampling method, the size of the point was different delivery hours of samples and different colours express different storage days at –80℃. (B) The sample number of different processed method
