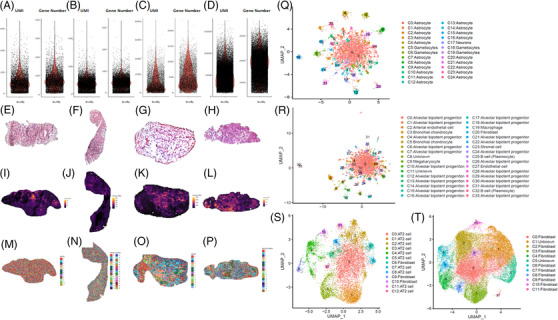
FIGURE 6.

The visualised image of spatial transcriptomics quality control. (A–D) Violin plot showing the UMI (left) and gene number (right) captured by Stereo‐seq at Bin50 with different sample tissues of squamous cell lung cancer. A (normal) and B (tumour) from one patient, C (normal) and D (tumour) from another patient; (E‐H) HE staining of samples corresponding to the spatial transcriptomics results. (I‐L) Spatial visualisation of the number of UMI captured by Stereo‐seq from two samples at bin 50 resolution. E and I (normal) and F and J (tumour) from one sample, G and K (normal) and H and L (tumour) from another sample; (M‐P) Unsupervised spatially‐constrained clustering of the different sample sections analysed by Stereo‐seq data at bin 50 resolution. I (normal) and J (tumour) from one sample, K (normal) and L (tumour) from another sample. (Q‐T) UMAP projection of Stereo‐seq data at Bin 50 with clusters from four sections of two samples. Q (normal) and R(tumour) from one sample, S (normal) and T (tumour) from another sample. AT2: Type II alveolar epithelial cells
