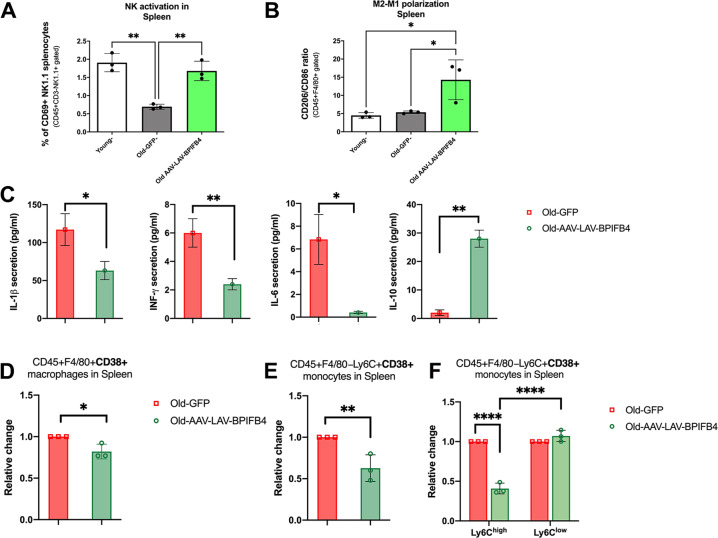
Fig. 3. Senescence profile of spleen-resident immune cells and catabolic activity of AAV-LAV-BPIFB4 infection.
A Flow cytometric quantification of the percentage of gated CD69+NK1.1+ among freshly isolated CD45+CD3-NK1.1+ splenocytes in n = 3 Young, n = 3 Old-GFP, and n = 3 Old-LAV-BPIFB4 mice. B Flow cytometric quantification of the CD206+/CD86+ ratio (indicative of the macrophage polarization into a M2 or M1 macrophage-like phenotype) among total CD11b+F4/80+ splenocytes in n = 3 Young, n = 3 Old-GFP and n = 3 Old-LAV-BPIFB4 mice. Results from each treatment group are expressed as mean ± SD. Pairwise comparisons statistically significant are indicated (*P < 0.05, **P < 0.01). Statistical evaluation was carried out by unpaired t-test (GraphPad® Prism). C ELISA quantification of inflammatory cytokines levels in splenocytes conditioned media of n = 3 Old-AAV-LAV-BPIFB4 mice as against those of n = 3 Old-GFP mice (*P < 0.05, **P < 0.01). Results are expressed as mean ± SD. Pairwise comparisons statistically significant are indicated (*P < 0.05, **P < 0.01). Statistical evaluation was carried out by ordinary one-way ANOVA corrected for Tukey’s multiple comparisons test (GraphPad® Prism). D Histogram shows the amount of CD45+F4/80+ CD38+ spleen-resident macrophages in n = 3 aged mice infected with AAV-LAV-BPIFB4 compared to n = 3 mice with GFP infection (*P < 0.05). Results are expressed as mean ± SD in terms of relative change to maximize the effect compared to their absolute percentage values (Supplementary Fig. 4). Pairwise comparisons statistically significant are indicated (*P < 0.05). Statistical evaluation was carried out by ordinary one-way ANOVA corrected for Tukey’s multiple comparisons test (GraphPad® Prism). E Bar graph shows the amount of CD45+F4/80-Ly6C+CD38+ spleen-resident monocytes in n = 3 aged mice infected with AAV-LAV-BPIFB4 compared to n = 3 GFP-infected mice (**P < 0.01) expressed as mean ± SD in terms of relative change. Pairwise comparisons statistically significant are indicated (**P < 0.01). Statistical evaluation was carried out by ordinary one-way ANOVA corrected for Tukey’s multiple comparisons test (GraphPad® Prism). F Frequency of CD45+F4/80-Ly6C+CD38+ spleen-resident monocytes stratified into Ly6Chigh and Ly6Clow from n = 3 Old-AAV-LAV-BPIFB4 mice vs n = 3 Old-GFP mice is reported (****P < 0.001). Results are expressed as mean ± SD. Pairwise comparisons statistically significant are indicated (****P < 0.0001). Statistical evaluation was carried out by ordinary one-way ANOVA corrected for Tukey’s multiple comparisons test (GraphPad® Prism).

