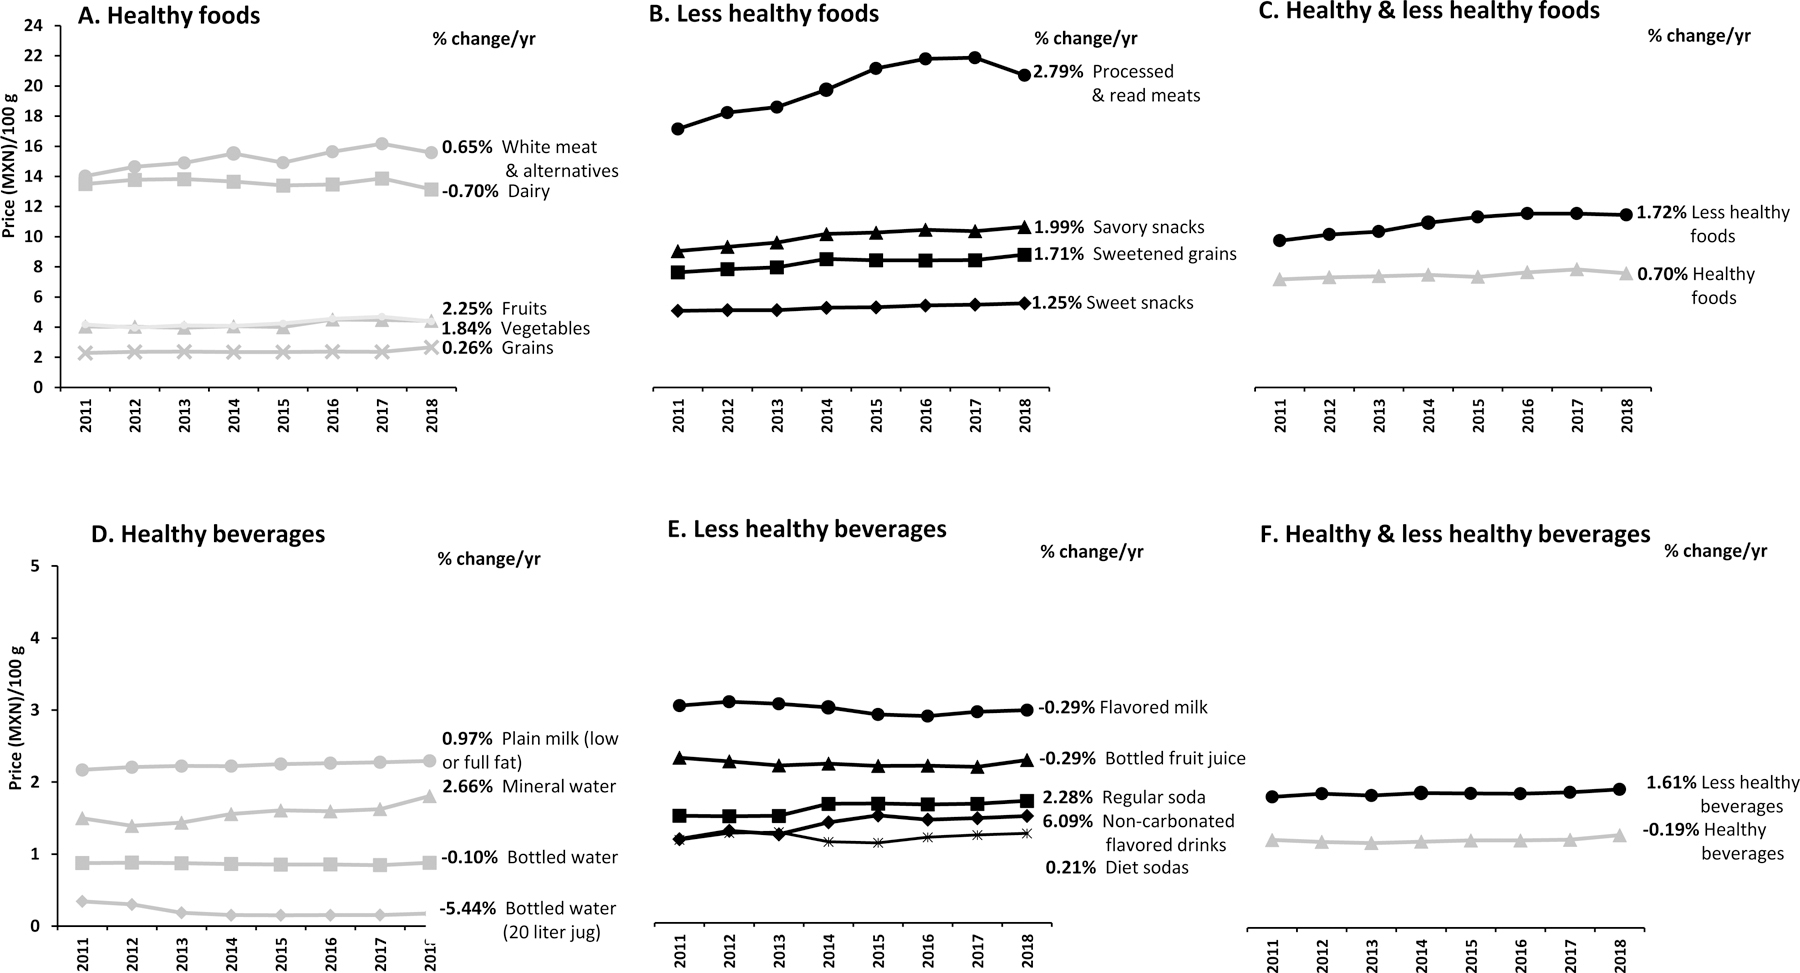
Figure 1. Average food/beverage price per year and average food/beverage price trend from 2011 to 2018 by healthiness in Mexico.

A) Healthy foods, B) Less healthy foods, C) Average of healthy and less healthy food, D) Healthy beverages, E) Less healthy beverages, and F) Average of healthy and less healthy beverages. Prices were obtained from those used to estimate the Consumer Price Index. The average price trend was estimated with a linear regression with the log(price) as the dependent variable and time (years 2011–2018) as the independent variable. MXN is Mexican pesos (~0.05 USD)
