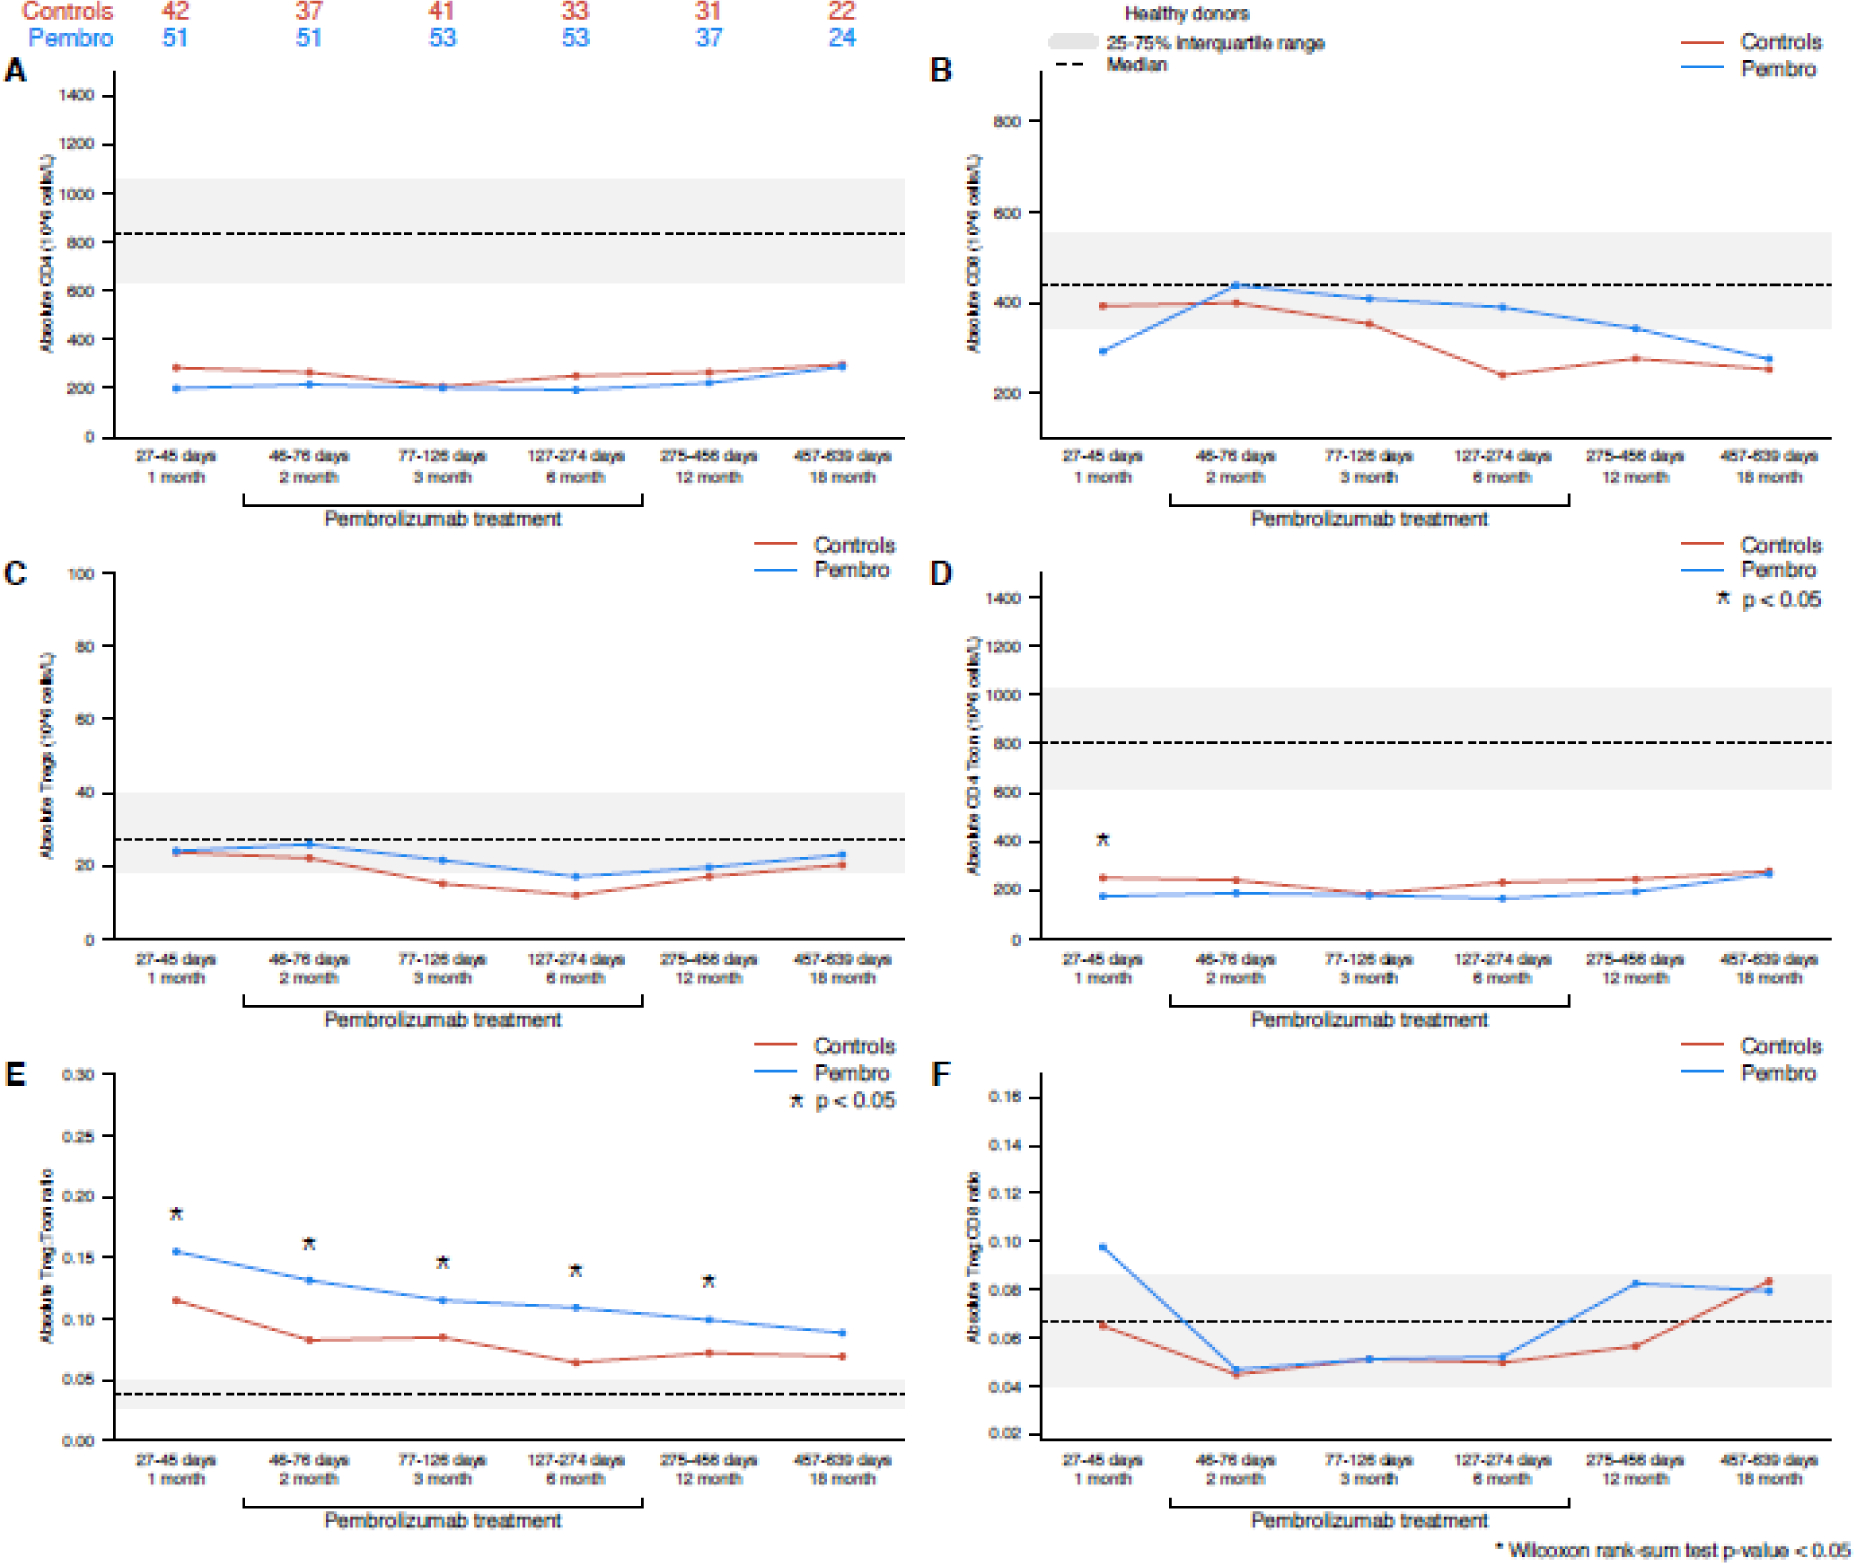
Figure 2 –

T cell subsets – (A) CD4+ T cells, (B) CD8+ T cells, (C) Tregs, (D) CD4 T con, (E) Treg:Tcon, (F) Treg:CD8 (pembrolizumab vs control cohort). The interquartile range of healthy control patients for each cell population is depicted as a gray bar, and the median value is noted with a dashed line.
