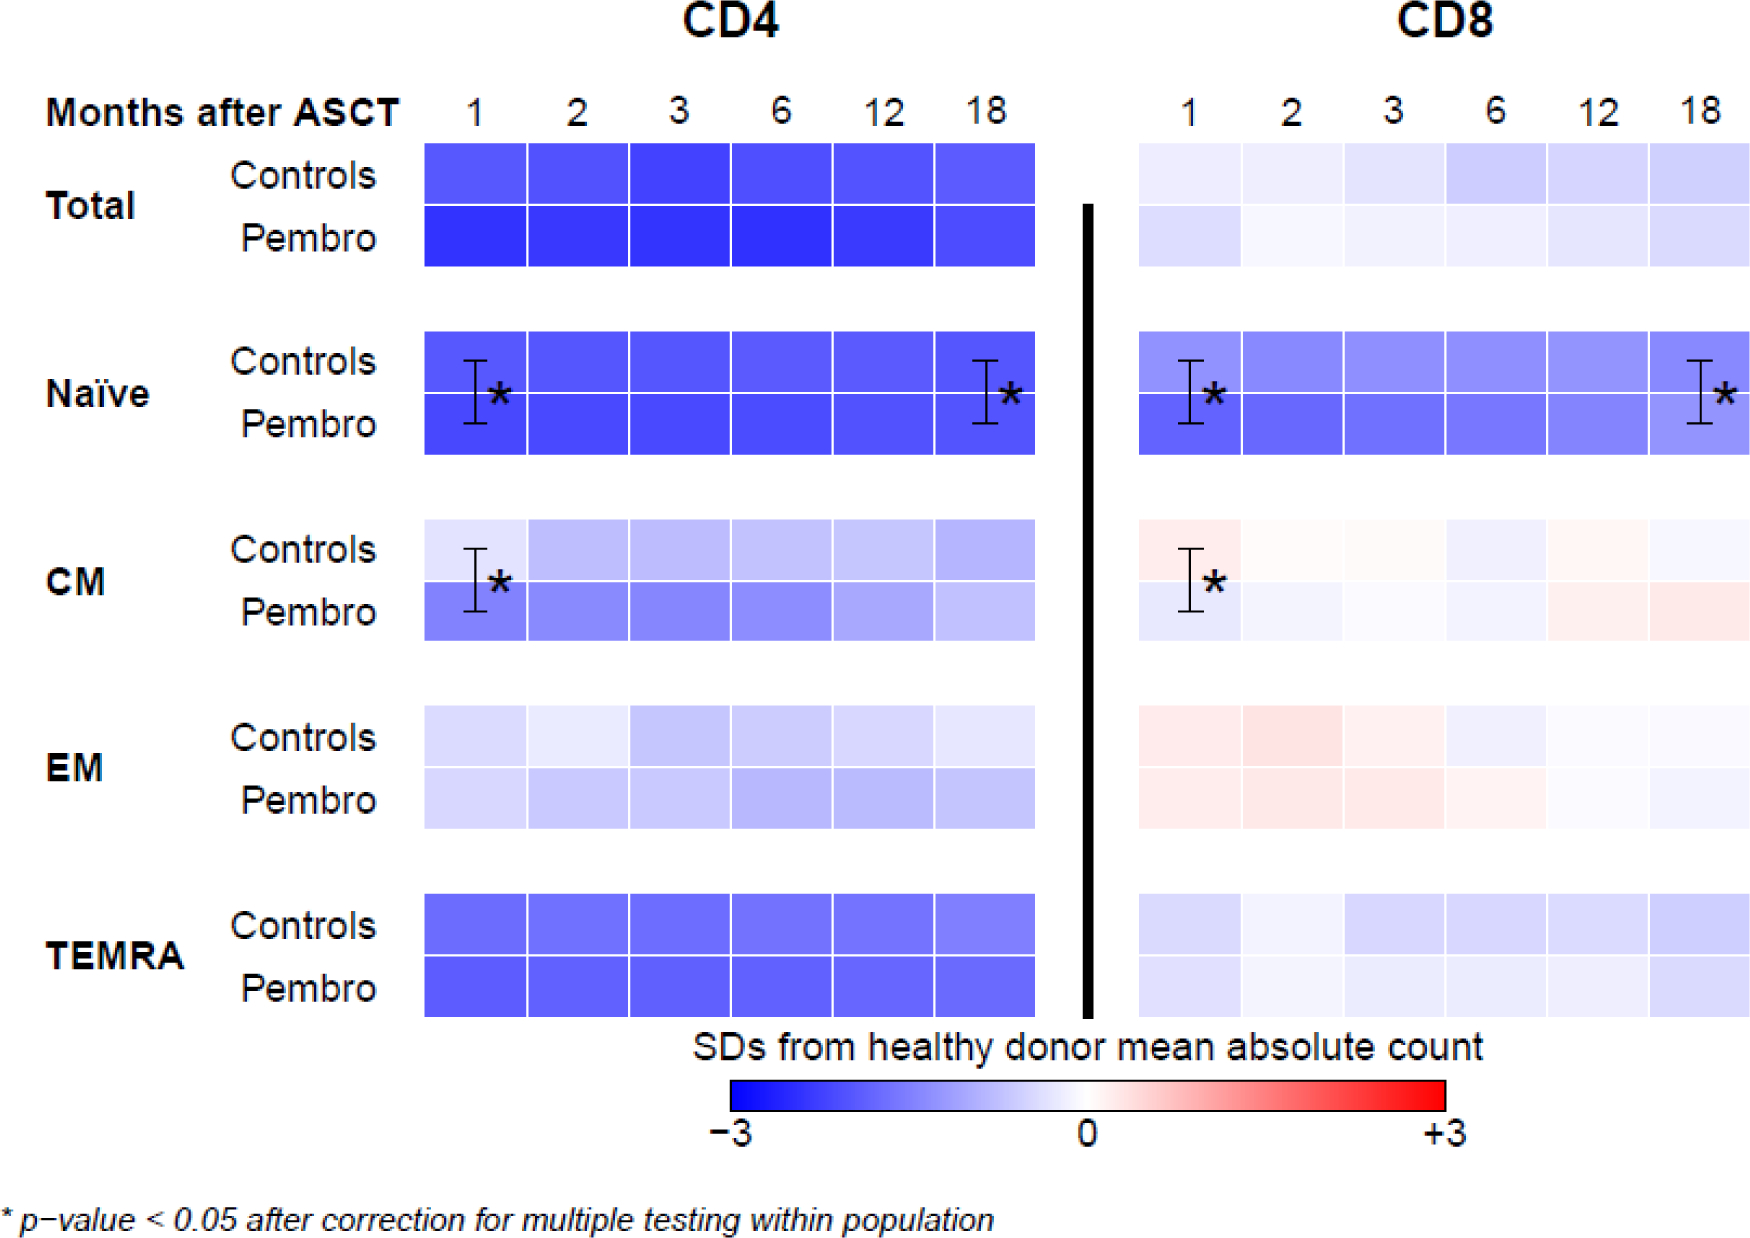
Figure 3 –

Heat map of naïve, central memory (CM), effector memory (EM), and terminally differentiated effector (TEMRA) CD4+ and CD8+ T cells (pembrolizumab vs control cohort). T cell subsets were quantified at multiple post-ASCT timepoints (1, 2, 3, 6, 12, and 18 months) among patients in the control and pembrolizumab cohorts. The absolute number of cells identified is displayed as a heatmap where blue, white, and red represent values less than, equal to, and greater than those of healthy donors. Significant differences between the control and pembrolizumab cohorts are marked with *. No significant differences between the two cohorts were observed during pembrolizumab treatment (i.e. at the 2, 3, and 6 month timepoints). Full recovery of multiple T cell subsets (represented in blue) was not achieved even 18 months following ASCT.
