
Figure 2. TSPAN12 associates with EoE diagnostic parameters and fibrostenotic features.
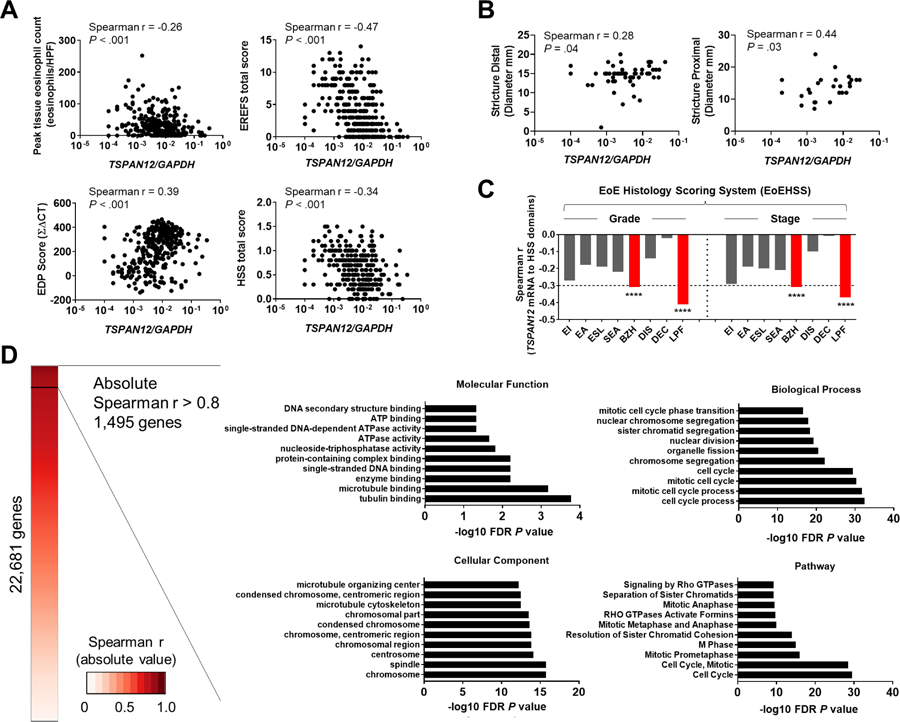
A, Associations between TSPAN12 expression and diagnostic parameters of gene expression, endoscopic, and histologic platforms. TSPAN12 expression levels correlate with peak esophageal eosinophils per HPF (upper left), total score from EREFS (upper right), EDP (lower left), and HSS (lower right). Markers represent individual subjects. B, Associations between TSPAN12 expression and stricture diameter (left, distal; right, proximal). Markers represent individual subjects. C, Associations (Spearman r values) between TSPAN12 expression and HSS domains (EI, eosinophilic inflammation; EA, eosinophilic abscess; ESL, eosinophilic surface layering; SEA, surface epithelial alteration; BZH, basal zone hyperplasia; DIS, dilated intercellular spaces; DEC, dyskeratotic epithelial cells; LPF, lamina propria fibrosis) for grade and stage are shown. ****P < .001. D, Functional enrichment analysis of the genes that strongly correlated with TSPAN12 (1,495 genes). Heatmap based on absolute Spearman r values between TSPAN12 and genes assessed by means of RNA sequencing.26 Shown are the 10 most significant terms by functional enrichment analysis in the following categories: Molecular Function (upper left), Biological Processes (upper right), Cellular Component (lower left), and Pathway (lower right). The x-axes represent the negative log10 FDR P value. EoE, eosinophilic esophagitis; EDP, EoE Diagnostic Panel; EREFS, EoE reference score; HSS, EoE Histology Scoring System; HPF, high-power microscopic field; FDR, false-discovery rate.