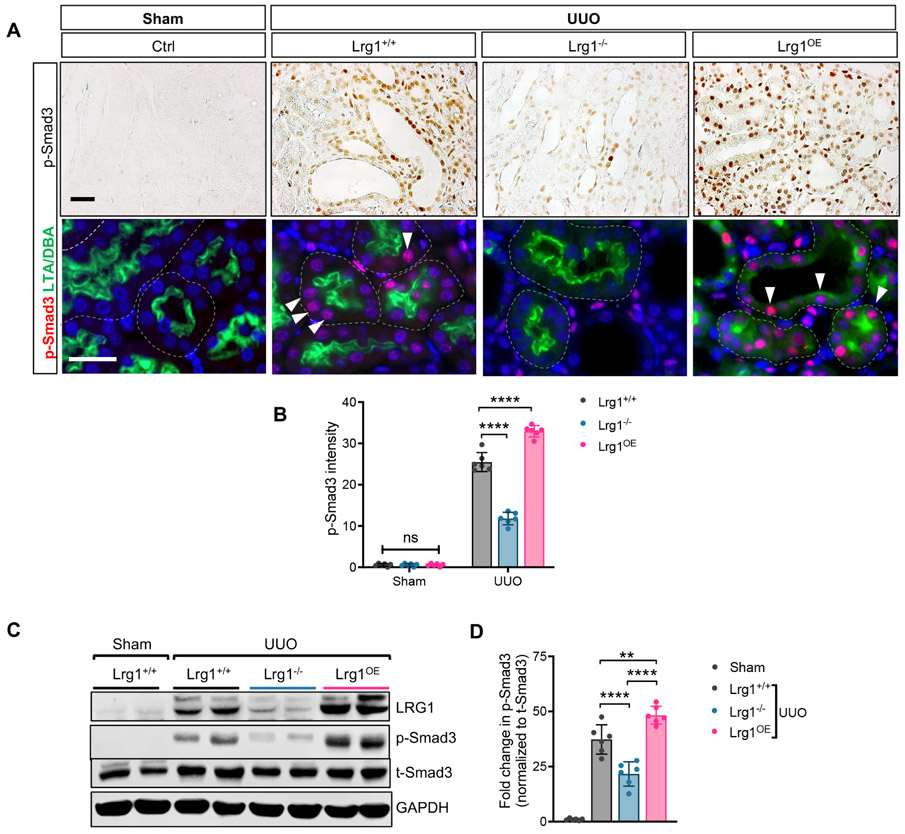
Figure 7. LRG1 enhances the TGFβ-mediated Smad3-activation in the RTECs of UUO kidneys.
(A) Representative images of phospho-Smad3 (p-Smad3) immunostaining on formalin-fixed paraffin-embedded sections and p-Smad3 immunofluorescence (red) co-stained with tubular markers (proximal tubular marker, Lotus tetragonolobus agglutinin (LTA) and collecting duct marker, Dolichos biflorus agglutinin (DBA), both in green) on frozen kidney sections of Lrg1+/+, Lrg1−/−, and Lrg1OE UUO mice. Scale bars, 50μm. Arrowheads show examples of p-Smad3+ tubular cells. (B) Quantification of immunohistochemical p-Smad3 intensity (in arbitrary units). (C) Representative western blot image of LRG1, phosphorylated and total Smad3 in kidneys of Lrg1+/+, Lrg1−/−, and Lrg1OE mice (n=6 mice per group). (D) Densitometric analysis of normalized pSmad3 intensity as a relative fold change to sham control. **p<0.01 and ****p<0.0001 when compared between indicated groups by 2-way ANOVA with Tukey’s post hoc test.

