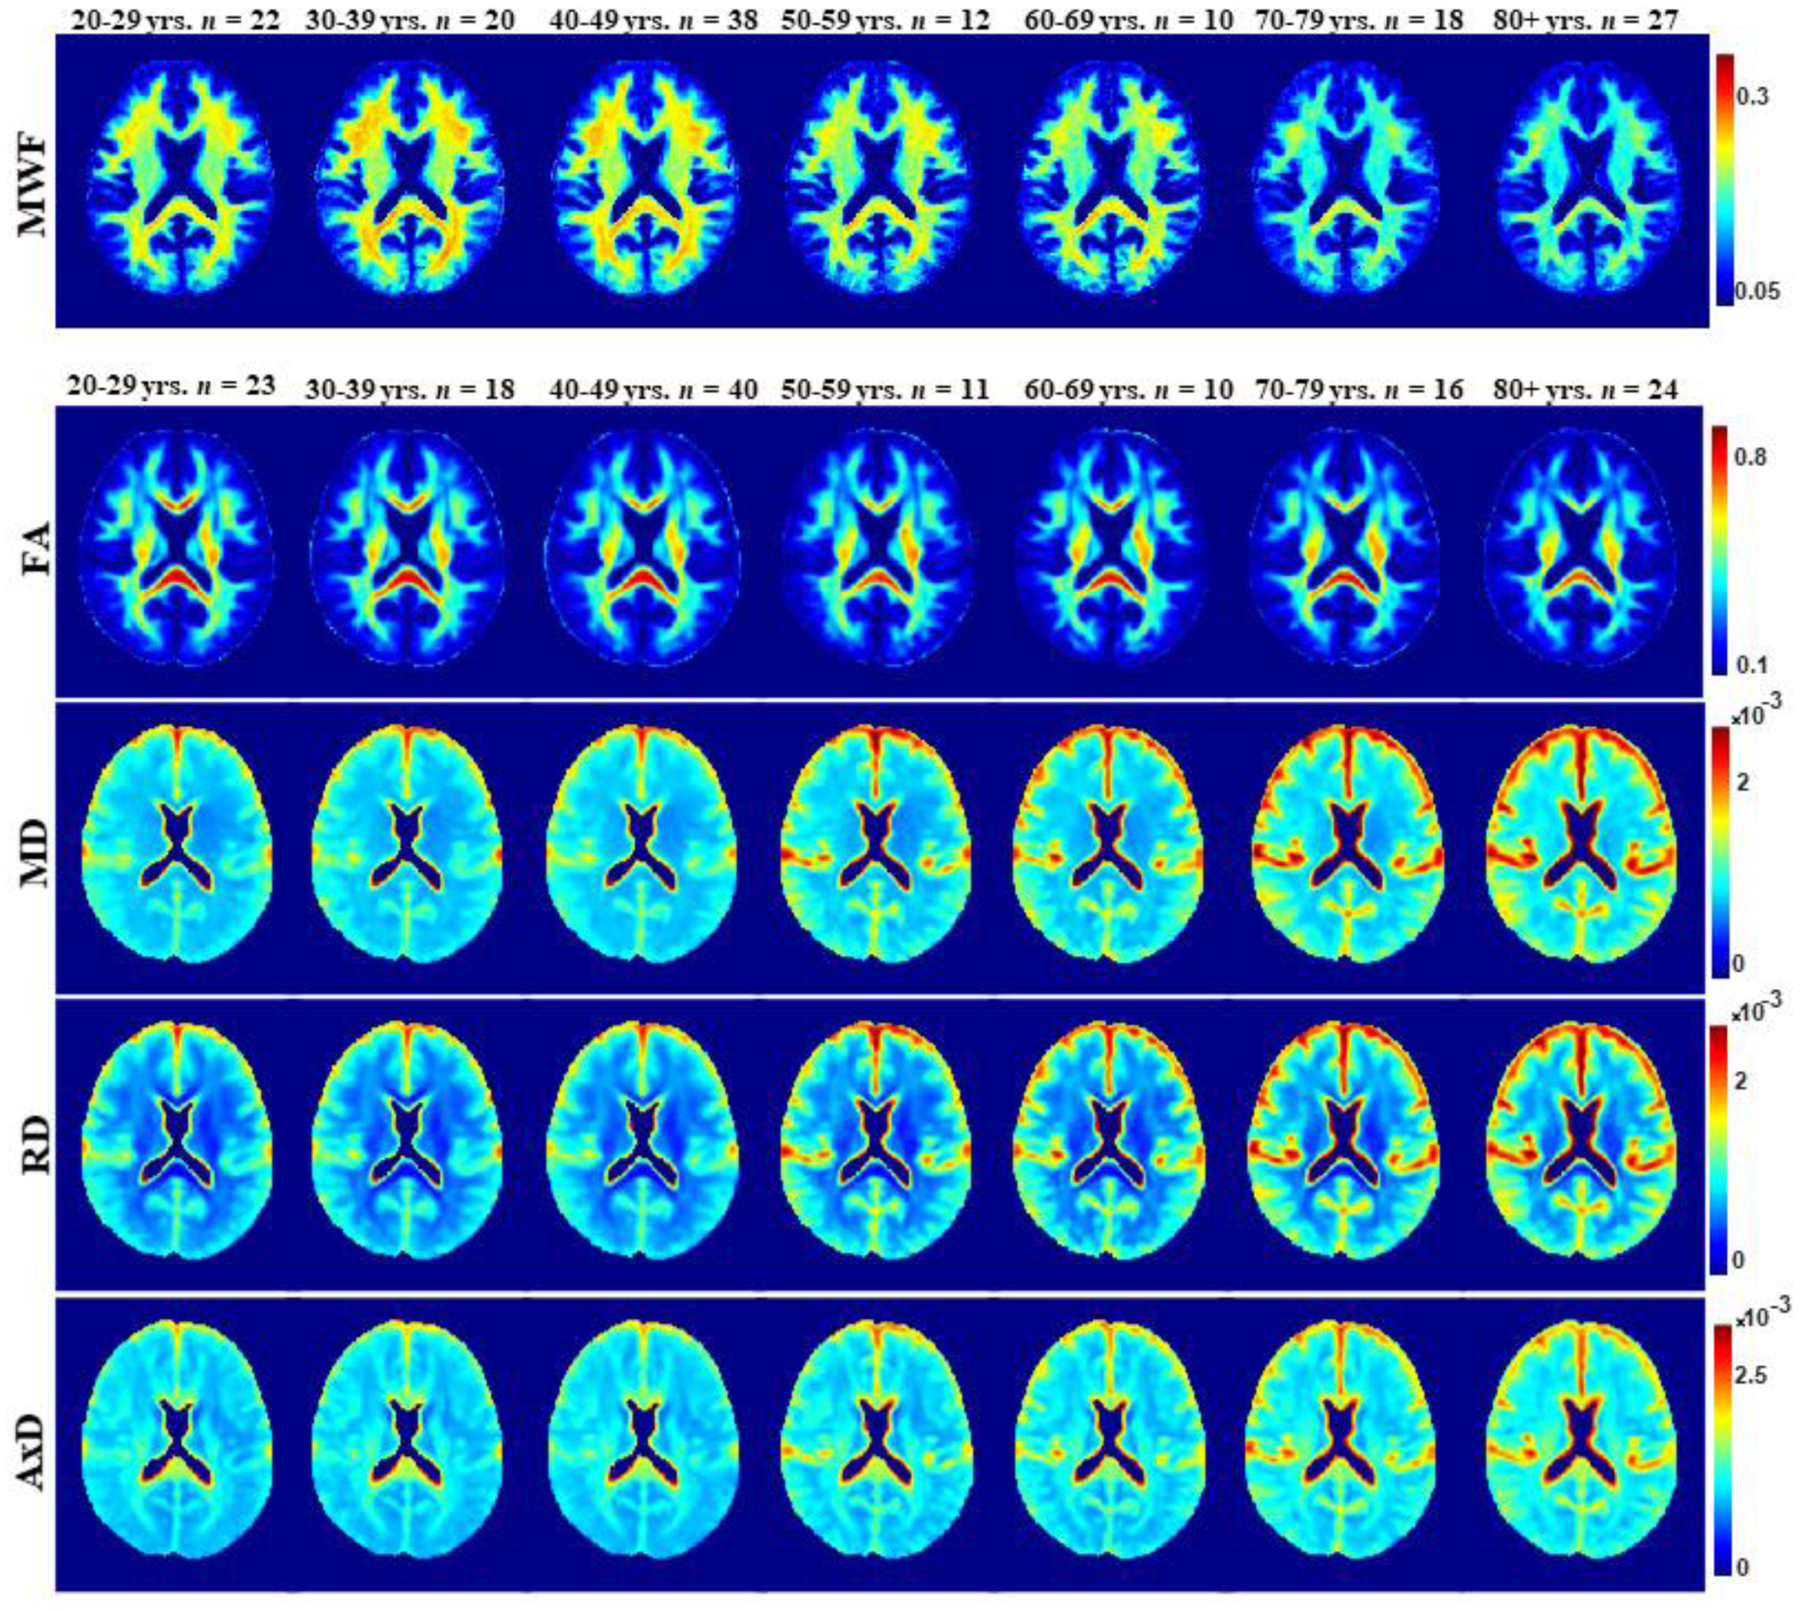
Figure 2.

MWF, FA, MD, RD, and AxD represented as averaged participant maps calculated across age decades. The displayed parameter maps correspond to slice number 90 of the MNI atlas. Visual inspection indicates an increase in MWF values from early adulthood to middle age, followed by a decrease in values afterwards. FA, MD, RD, and AxD show earlier peaks in early adulthood, with lower FA values and higher MD, RD, and AxD values at advanced age.
