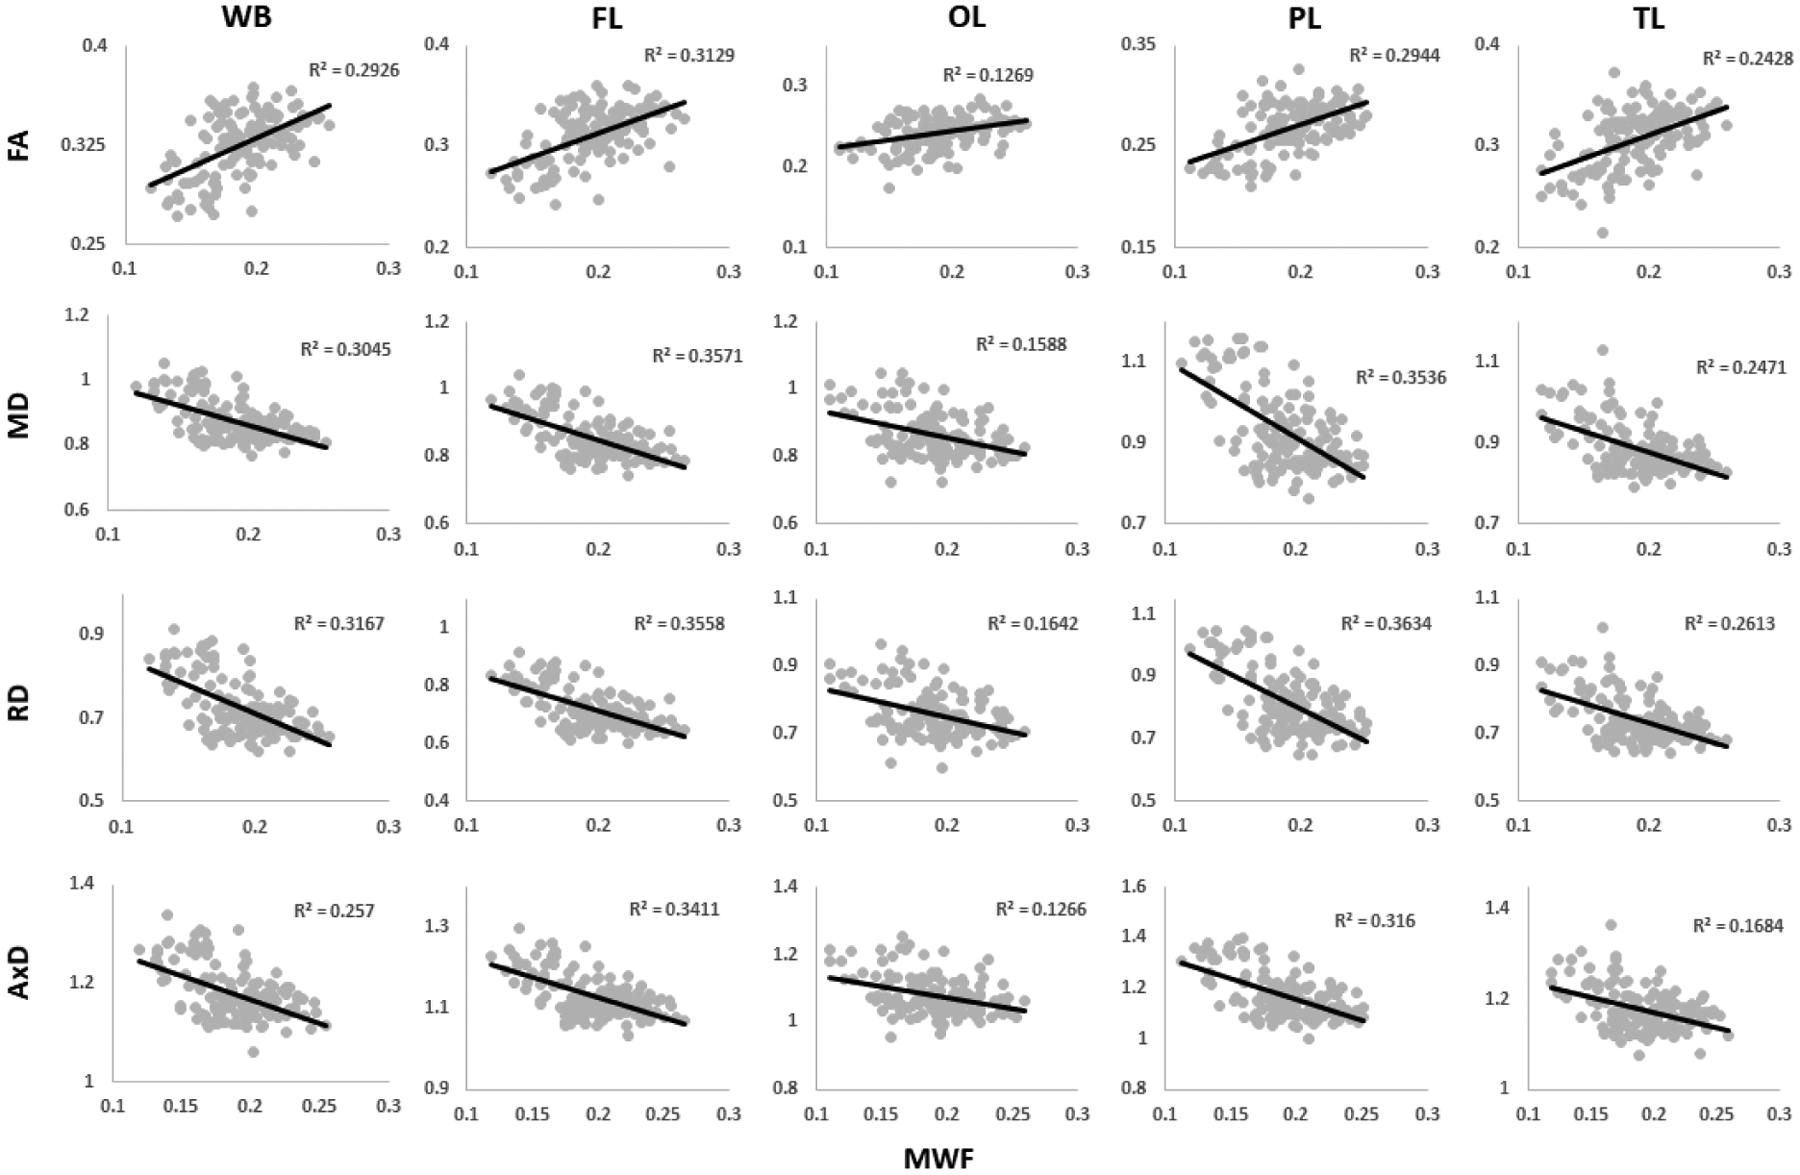
Figure 5.

Plots illustrating regional Pearson correlations between FA, MD, RD, or AxD and MWF for five representative cerebral white matter ROIs corresponding to the whole brain (WB) WM, frontal (FL), occipital (OL), parietal (PL), and temporal (TL) lobes WM. For each ROI, the coefficient of determination, R2, is reported. Plots of all ROIs can be found in the Supplementary Material (Figs. S6–S9).
