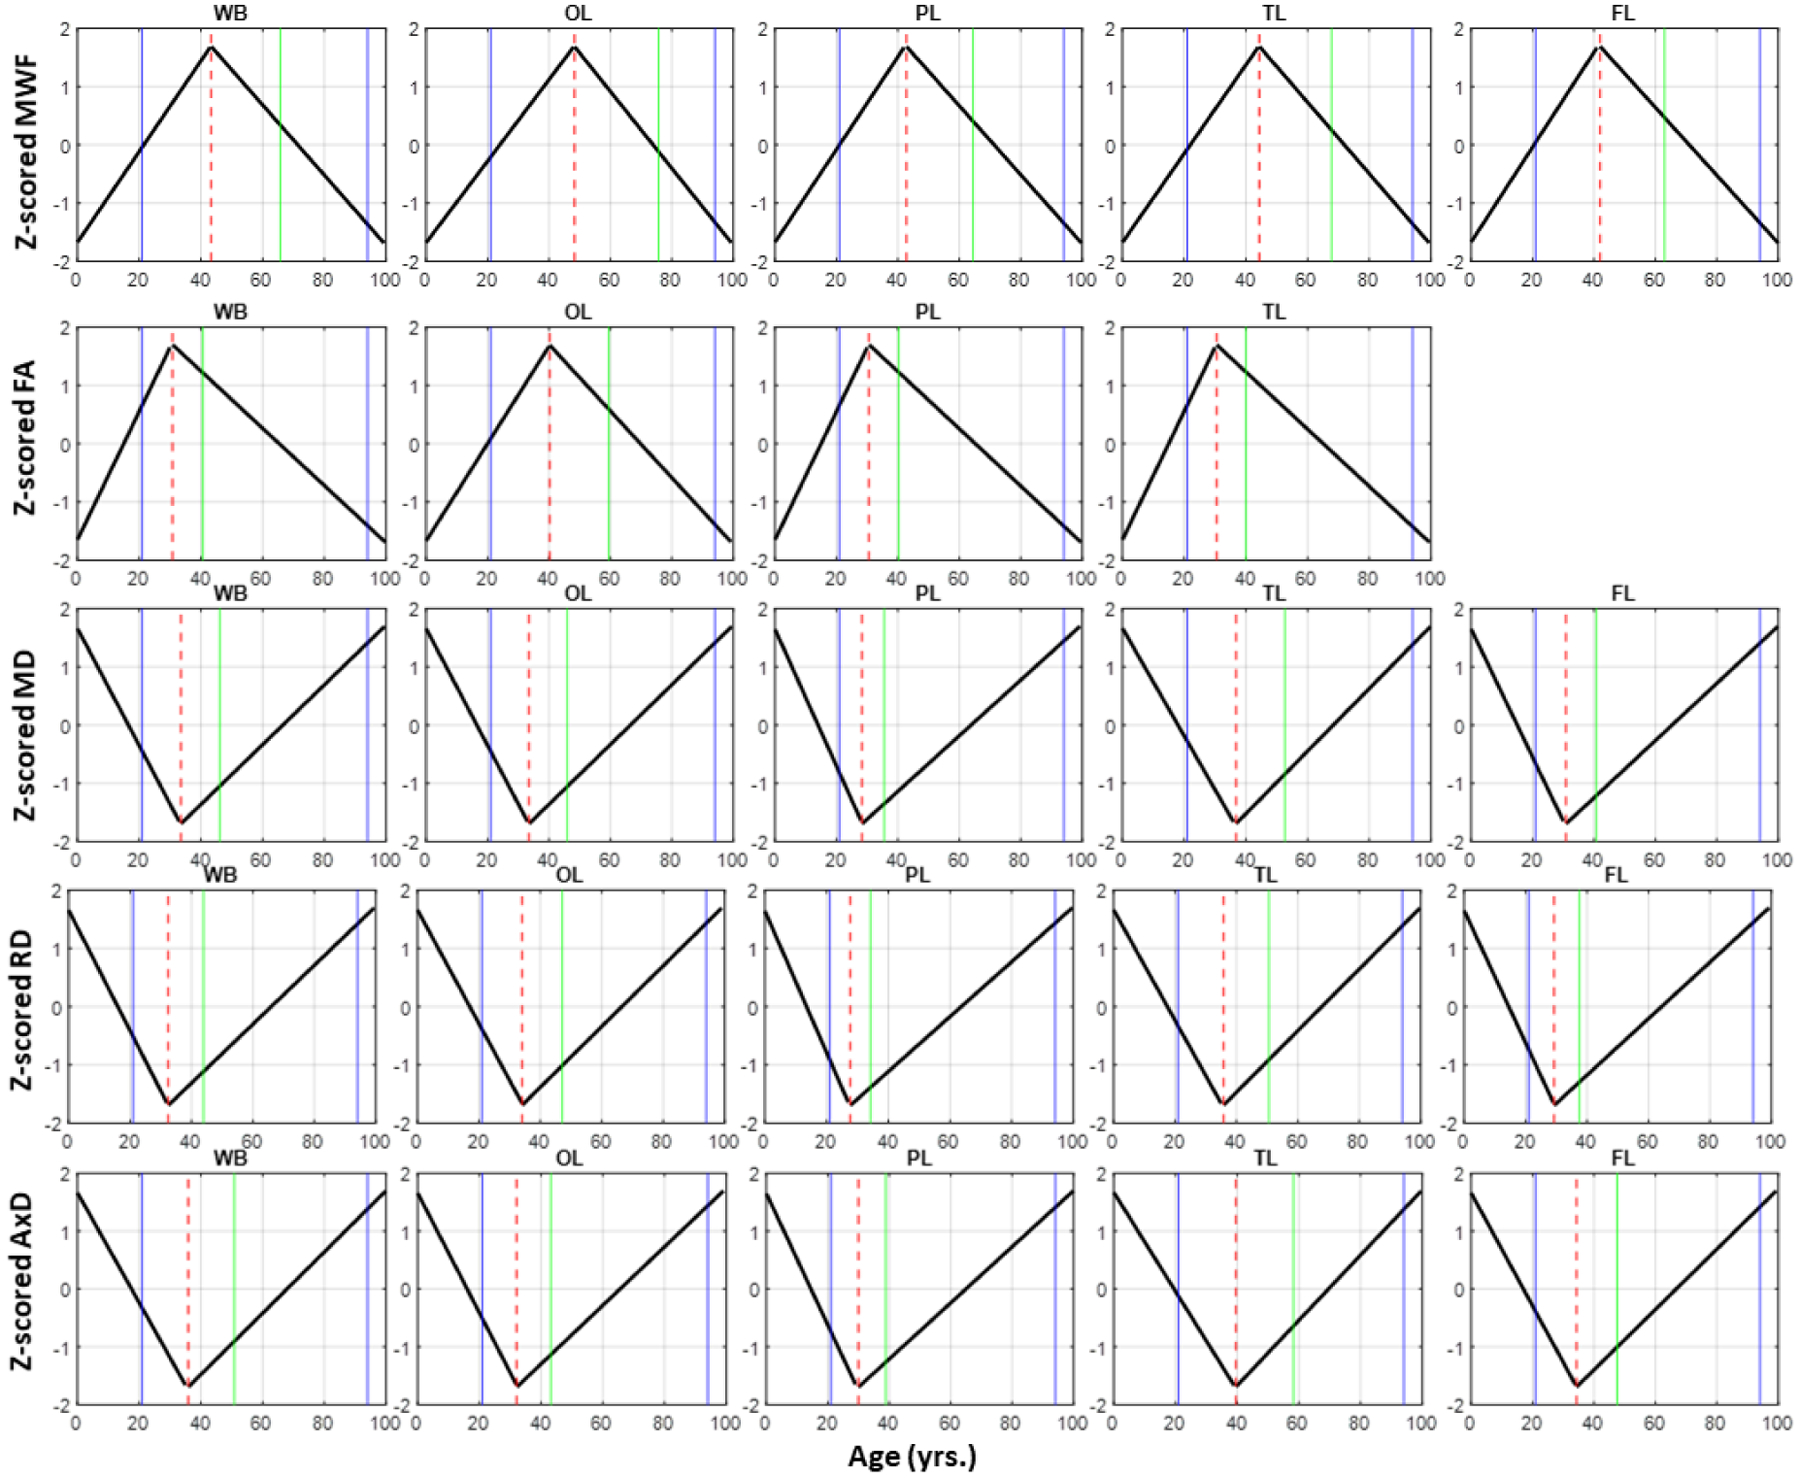
Figure 6.

Plots illustrating the piecewise linear fits of the maturation and degeneration phases as a function of age for all MR parameters and 5 representative ROIs: whole brain (WB) WM, frontal (FL), occipital (OL), parietal (PL), and temporal (TL) lobes WM. The blue solid lines indicate the actual age range of our cohort, the dashed red line indicates the peak ages, while the green line indicates the age at a symmetrical age interval between the minimum age of our cohort and the peak. Plots of all ROIs can be found in the Supplementary Material (Figs. S10–S14).
