
Figure 3 |. Identification of hypertrophy pathways and transcription networks associated with disproportionate jerboa metatarsal elongation.
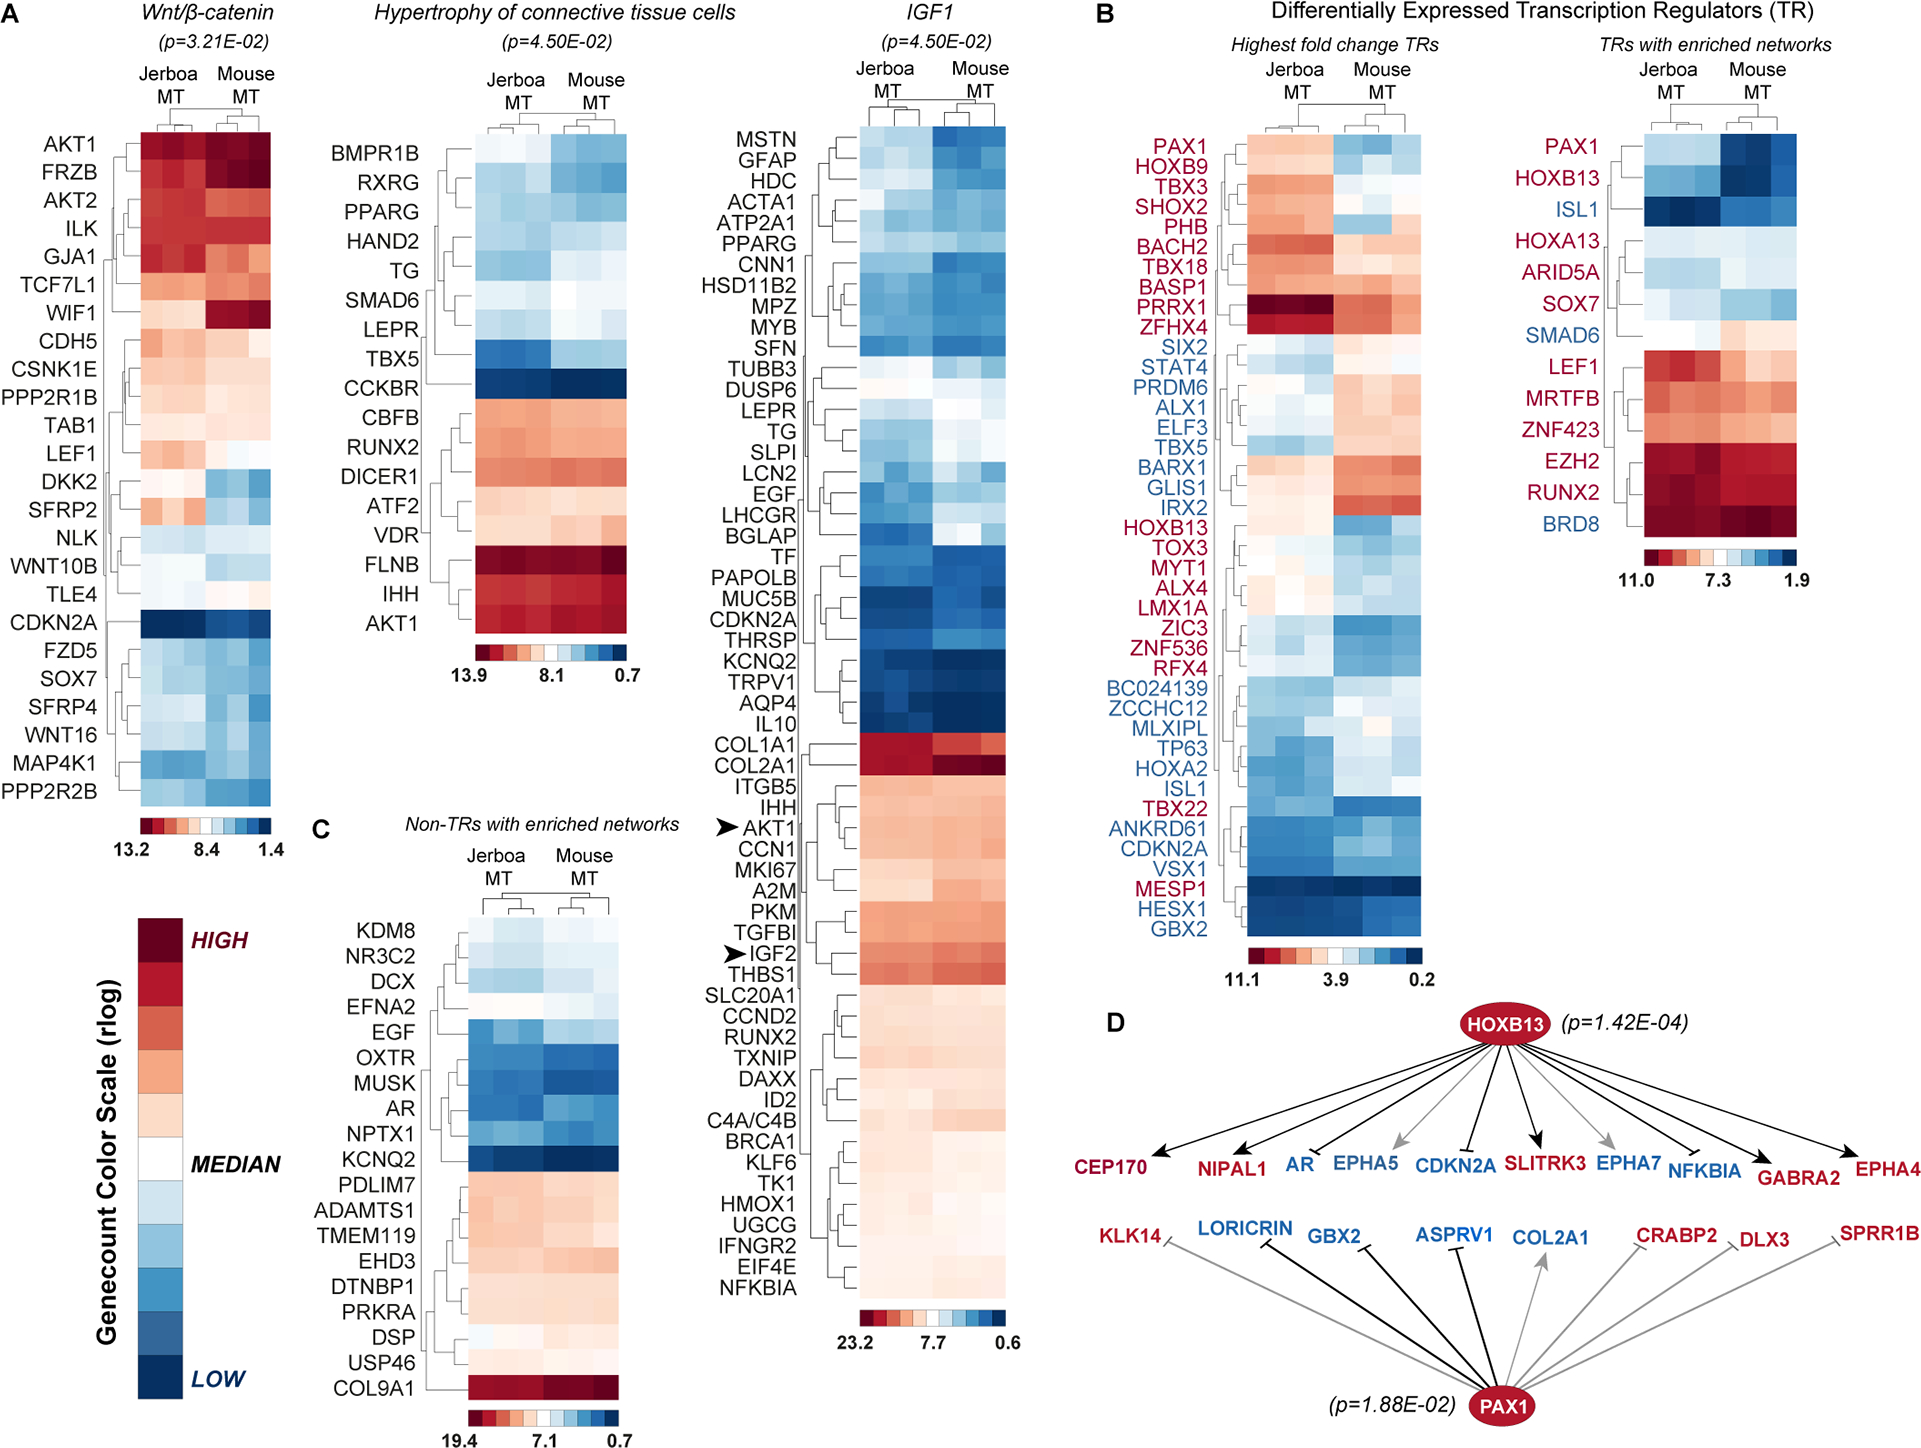
(A-C) Regularized log-transformed gene count heatmaps for genes that are disproportionately differentially expressed between jerboa (n=3) and mouse (n=3) MTs. Red, white, and blue colors indicate high, median, and low r-log genecount values, respectively. Color scales that indicate the genecount range within each heatmap are shown with internally assigned color values. (A) Genes in the enriched Wnt/β-catenin signaling network, those enriched within a hypertrophy of connective tissue network, and genes enriched in the IGF-1 signaling network (p-values <0.05). (B) The 40 transcription regulators that are most differentially expressed in MT of the two species. Thirteen differentially expressed transcription regulators that are each in networks with putative target genes that are enriched in our dataset. (C) Differentially expressed non-transcriptional regulators with putative networks enriched in our dataset. (D) Downstream networks of HoxB13 and Pax1 transcription regulators. Grey lines indicate that the direction of gene expression change is the opposite of what has been demonstrated in other contexts. Red and blue gene names in (B,D) indicate genes with higher or lower expression, respectively, in jerboa metatarsals compared to mouse. See also Table S6 and S7.