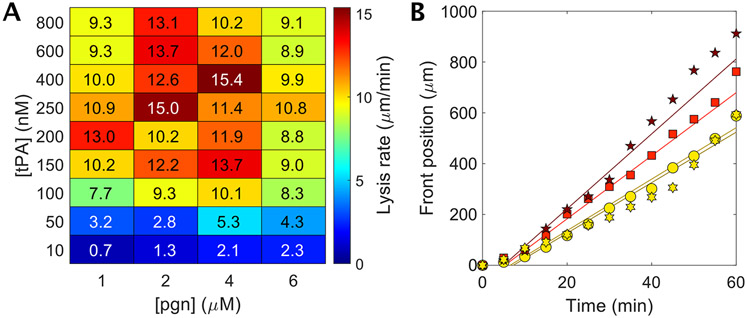
Fig. 2:
Measuring the fibrinolytic speed limit of plasma clots. A) Heat map of lysis rates as a function of tPA and plasminogen (pgn) concentrations. The accelerated fibrinolysis (AF) zone incorporates regions with lysis greater than 13.5 μm/min. Symbols denote data shown in panel B. Overlaid numbers indicate exact lysis rates measured. The numbers align with the exact concentrations of tPA and plasminogen used for that measurement. n = 1 – 3. Lysis rates are average rates over 60 min (Fig. 2B). B) Dissolution of fibrin at 400 nM tPA with endogeneous plasma plasminogen concentration (1 μM) and the addition of exogenous plasminogen up to 6 μM total plasminogen concentration. Lysis rates are linear with time. Regression fits for 1, 2, 4 and 6 μM data have R2 = 0.95, 0.98, 0.98, and 0.95, respectively.

