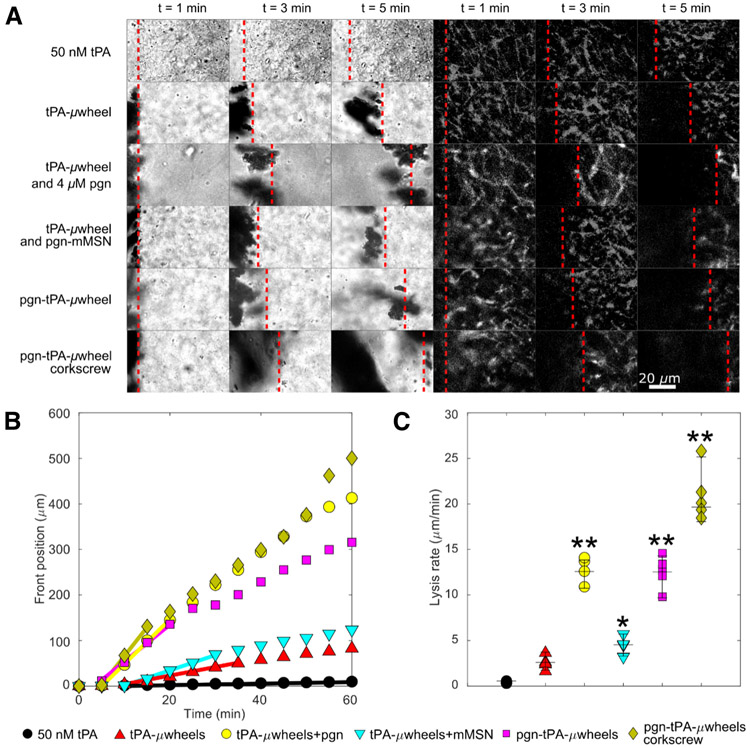
Fig. 4:
A) Time lapse of lysis of plasma clots using different μwheel formulations. Brightfield at left, and fluorescently labeled fibrin(ogen) at right. Dashed lines indicate the front position. B) FDP generated by each formulation. C) Representative lysis curves for each formulation. Lines indicate periods of maximum lysis rates lasting for a minimum of 10 min. D) Maximum lysis rates for each formulation. Corkscrew condition uses pgn-tPA-μwheels. Dotted line indicates biochemical speed limit (see Fig. 2B). *Statistically significant from 50 nM tPA with p-value 0f 0.01. **Statistically significant from 50 nM tPA with p-values <0.0001.

